0%
1.2 Data and science
Section outline
-
-
Evolution of science
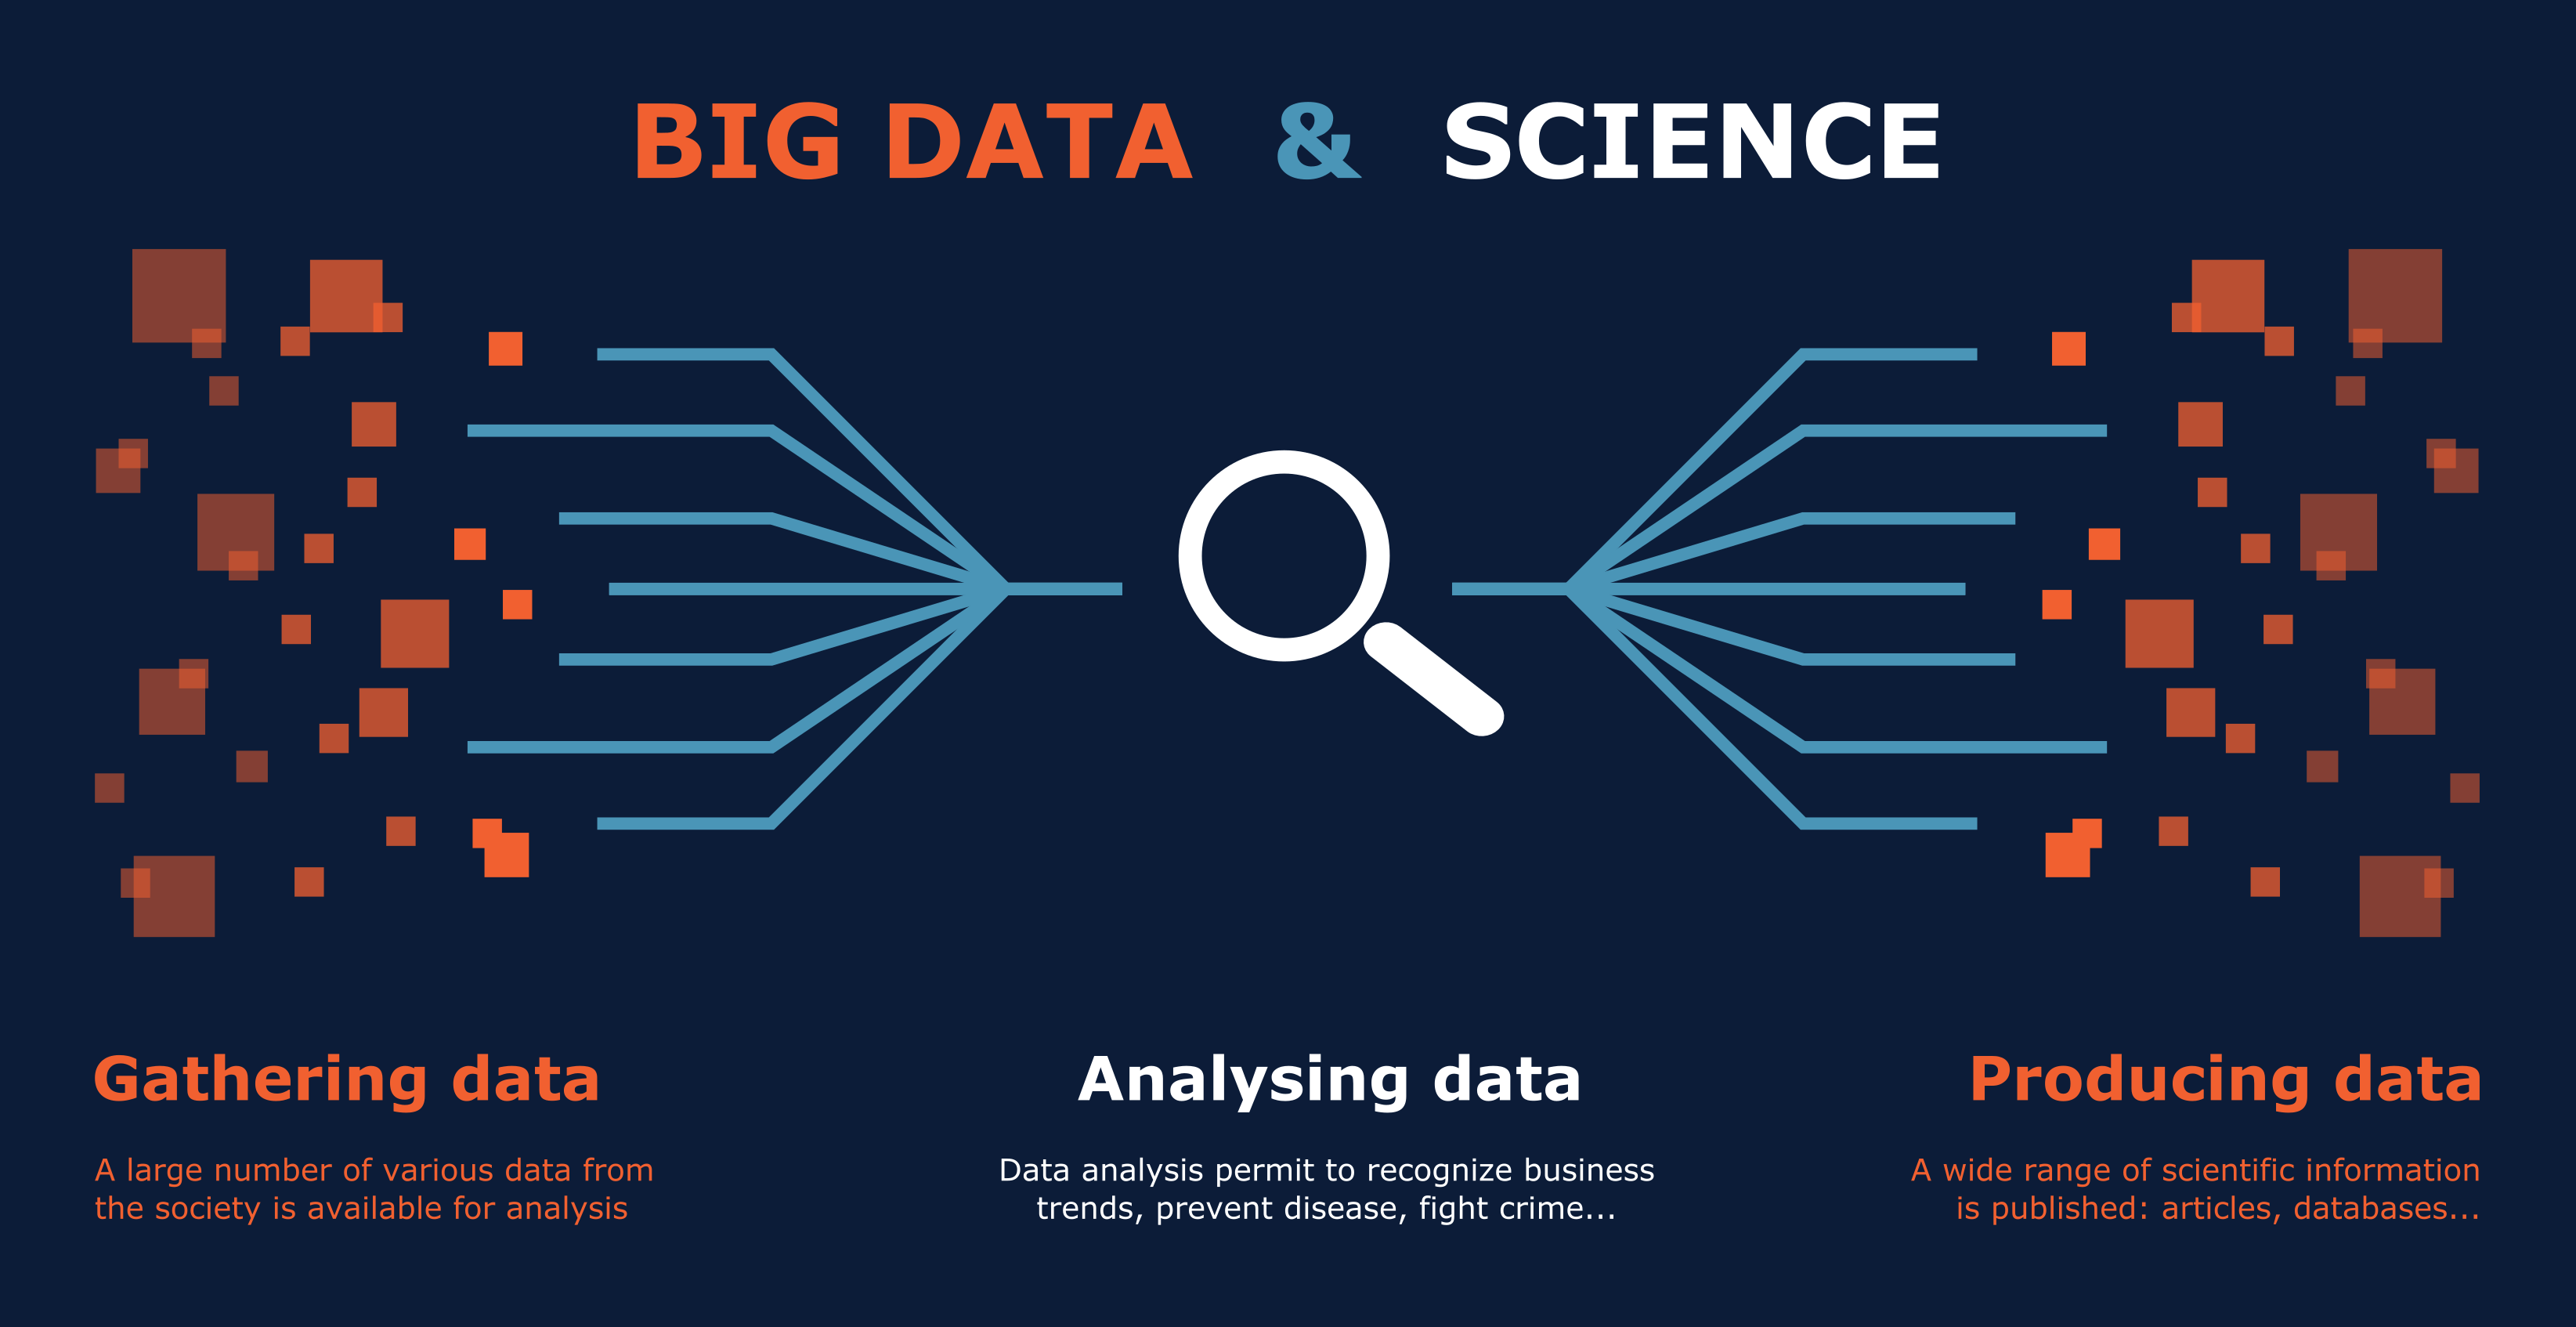
The way science looks today differs greatly from the scientific practices of the past. The colossal amount of data and the tools for handling them have a dramatic effect on the way science is done.
Big Data is changing science in two ways:
- Science can gather increasing amounts of data from the society that may be used for analysis.
- Scientific activities themselves also produce larger amounts of data than ever before. Big data and science
We live in a data-driven world. At any time we have access to a huge amount of digital information, which is growing daily. The increase in the amount of available data has opened the door to a new area of research based on big data - huge data sets that contribute to the creation of better operational tools in all sectors as well as develop scientific research. -
 By Calvinius — Personal work: http://www.martingrandjean.ch/wp-content/uploads/2013/10/HumanitesNumeriques.jpg, CC BY-SA 3.0, https://commons.wikimedia.org/w/index.php?curid=29275453
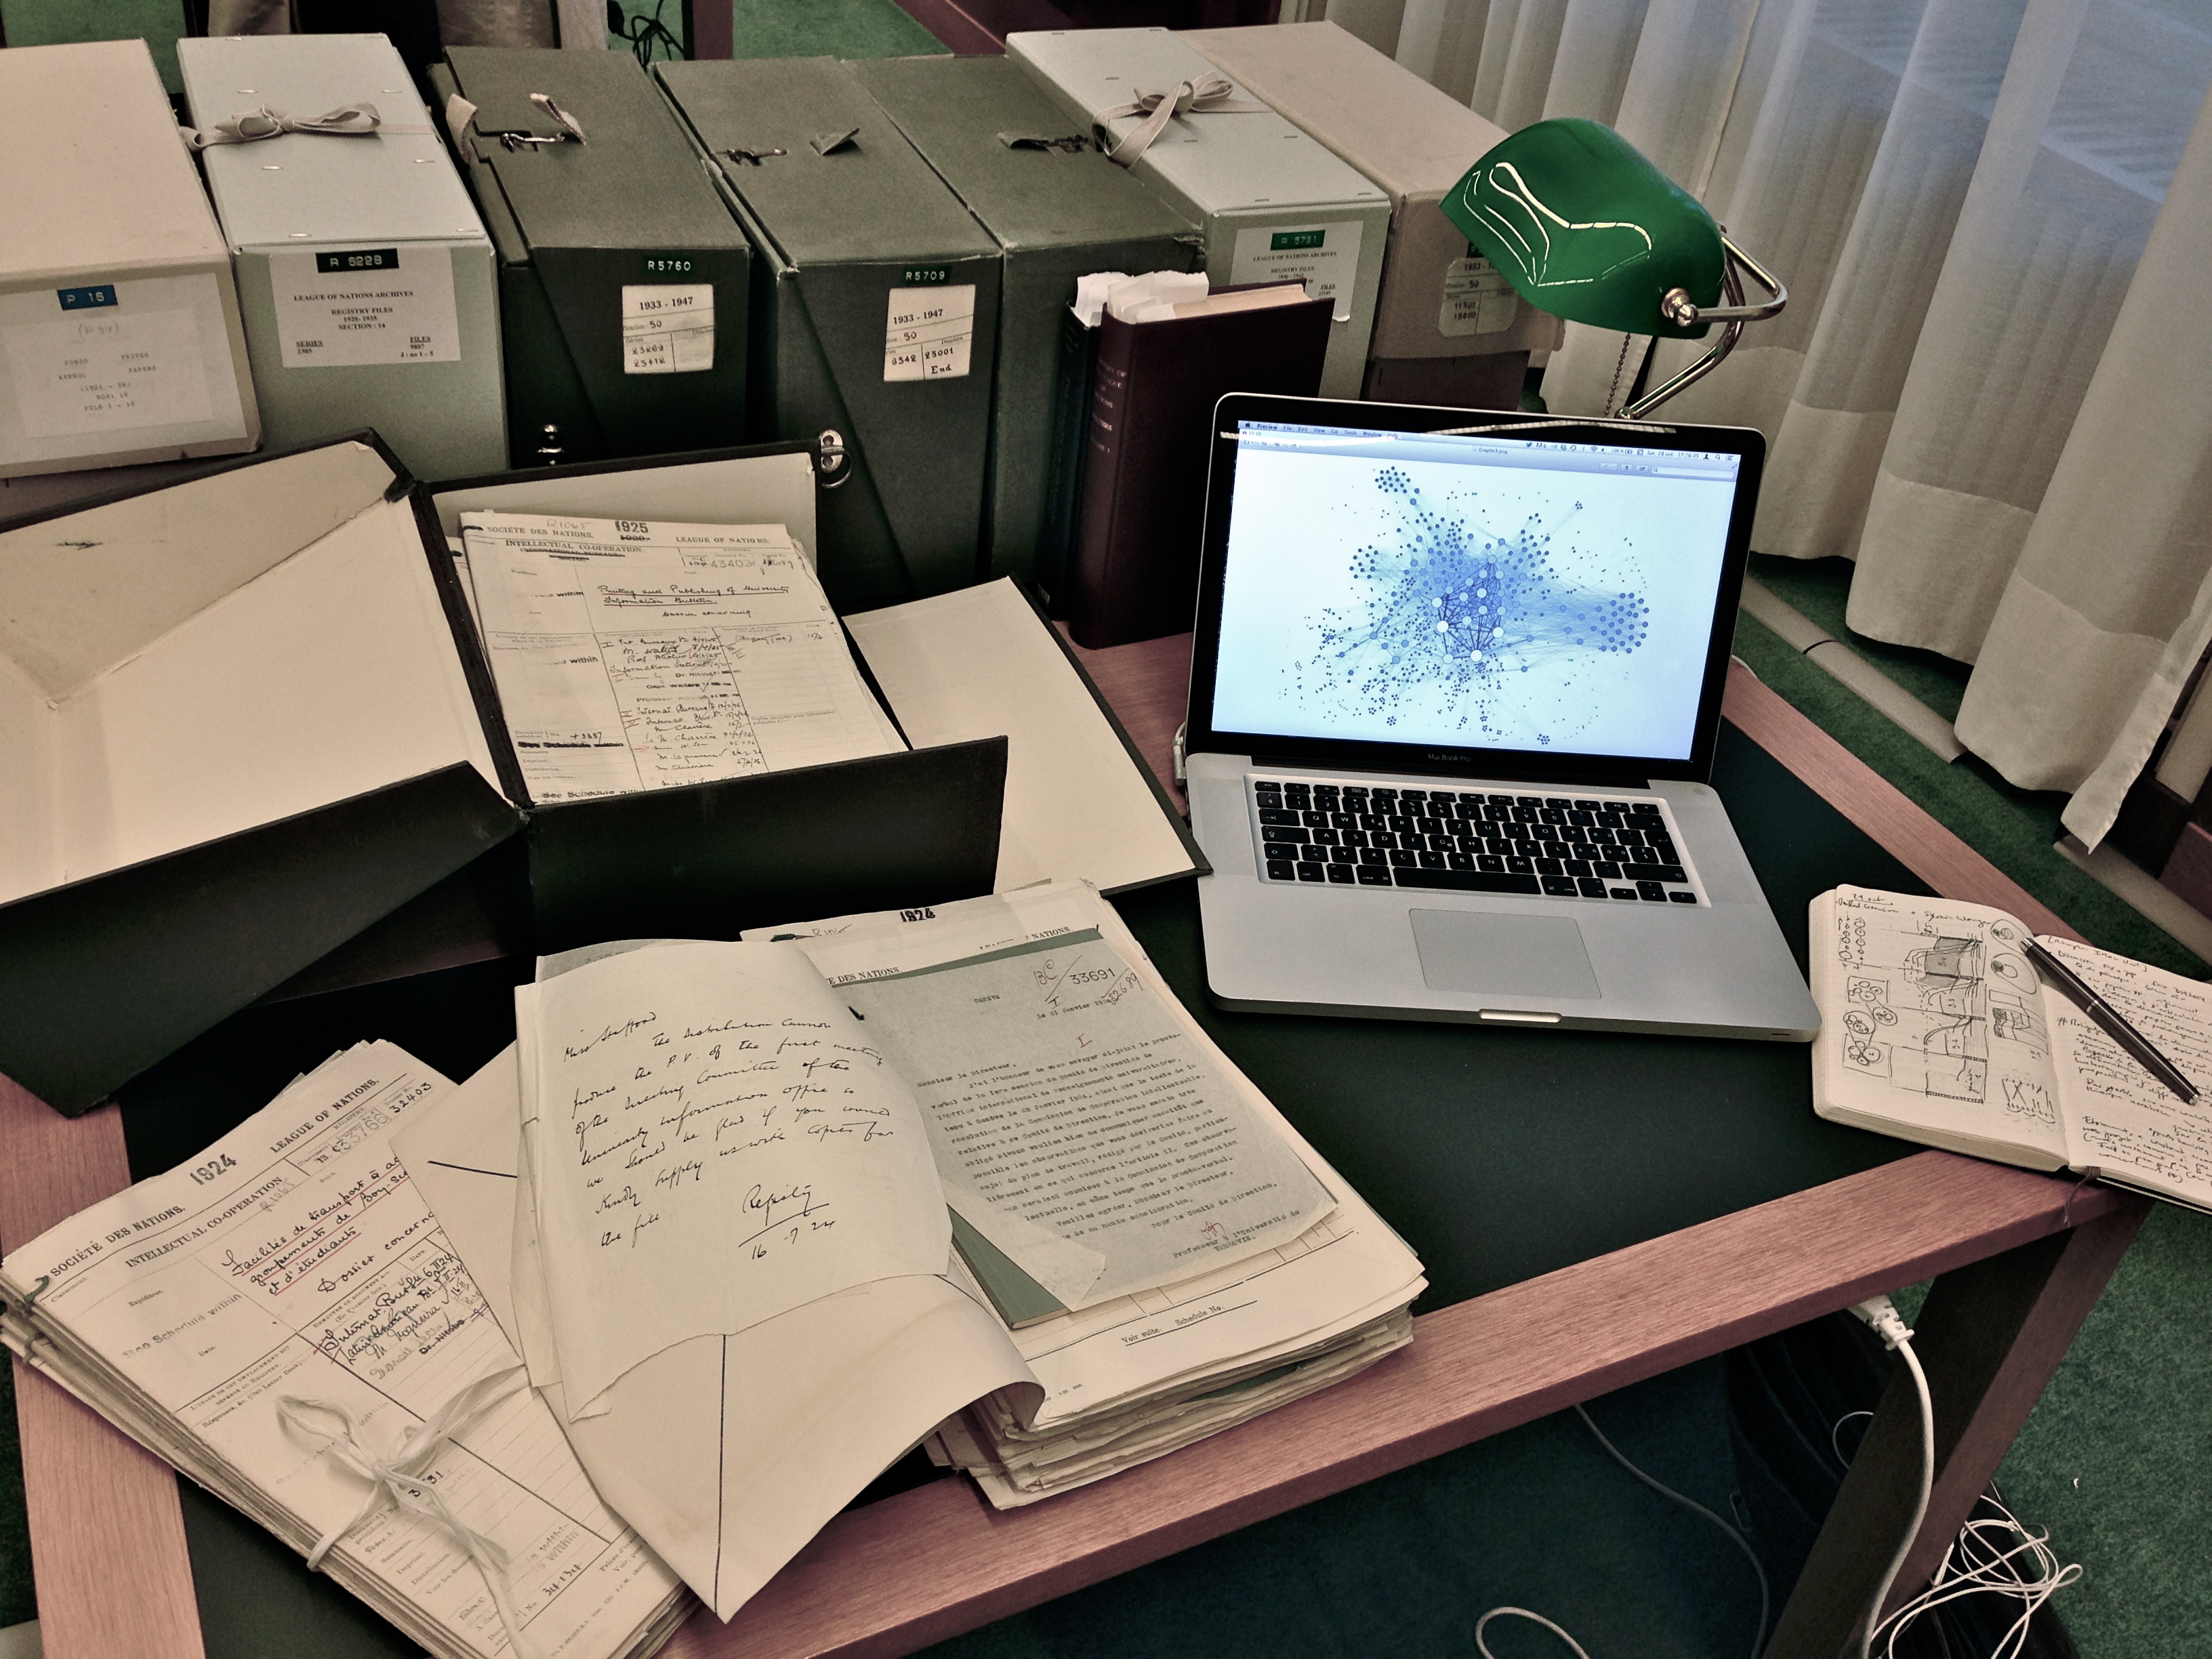
At the beginning, the digital humanities were mainly curating and analyzing data that were born analogue (texts, objects and images) but subsequently archived into digital forms that could be searched for automated guide analysis and visualization. Today, digital humanities consist of the use of sophisticated tools of curating and sharing data, augmenting the scale of research across a more vast range and volume of sources. Rather than concentrating on a basket of sources to analyze, it becomes possible to manage thousands of cultural products (paintings, books, photos, articles, etc.). Counting, classifying, graphing and mapping these data may offer new insights and raise interest in humanities as a field of science.Some common practices in Digital Humanities are Text and Data Mining and Data visualization.
By Calvinius — Personal work: http://www.martingrandjean.ch/wp-content/uploads/2013/10/HumanitesNumeriques.jpg, CC BY-SA 3.0, https://commons.wikimedia.org/w/index.php?curid=29275453
At the beginning, the digital humanities were mainly curating and analyzing data that were born analogue (texts, objects and images) but subsequently archived into digital forms that could be searched for automated guide analysis and visualization. Today, digital humanities consist of the use of sophisticated tools of curating and sharing data, augmenting the scale of research across a more vast range and volume of sources. Rather than concentrating on a basket of sources to analyze, it becomes possible to manage thousands of cultural products (paintings, books, photos, articles, etc.). Counting, classifying, graphing and mapping these data may offer new insights and raise interest in humanities as a field of science.Some common practices in Digital Humanities are Text and Data Mining and Data visualization. -
Text and Data Mining
Text mining, or Text and Data Mining (TDM), is a field which, with the use of appropriate tools, deals with text analysis, exploration, preparation of summaries, clustering and categorisation of documents, finding groups of words with similar meaning or automatic recognition of complex expressions.
By using text-mining methods it is possible to obtain data from the text that are suitable for quantitative statistical analysis. Using text mining represents a completely different approach to text data. They are no longer treated as purely qualitative data, but as a specific source of quantitative data - above all, on the frequency of occurrence of individual words in the analysed text. Text mining allows relatively automated searches of very large portions of text for keywords, their density and so on. This makes it possible to apply new methods of data analysis and to obtain new types of information concerning, among other things, the nature of the analysed texts or the variation in the frequency of keywords over time.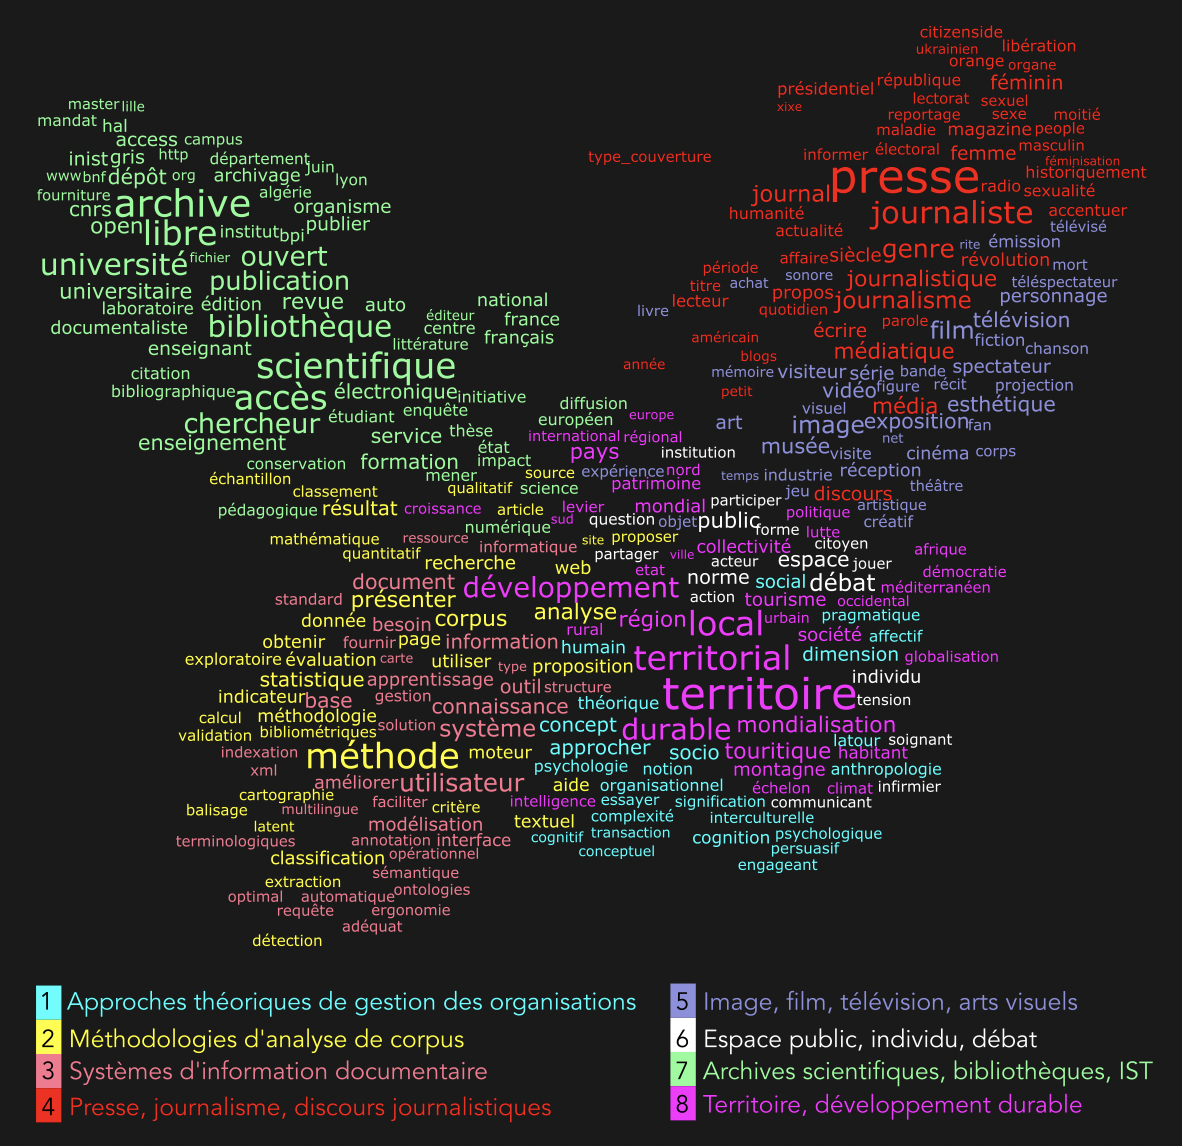 Gabriel Gallezot, Marty Emmanuel. Le temps des SIC. MIÈGE, Bernard, PELISSIER, Nicolas et DOMENGET. Temps et temporalités en information-communication: Des concepts aux méthodes., L’Harmattan, pp.27-44, 2017, 10.5281/zenodo.1000778. sic_01599944
-
Data visualization
This modernised technology (and at the same time methodology) is increasingly present in every sphere of human activity: from research and development to business, social activities and art. It offers practical knowledge of how to graphically "master" huge sets of data that describe a given aspect of reality.
The purpose of data visualization is to show information in a way that allows its accurate and effective understanding and analysis. This is because people easily recognize and remember the images presented to them (shape, length, construction etc.). Thanks to visualization we can combine large data sets and show all the information at the same time, which greatly facilitates analysis. We can also use visual comparisons, thanks to which it is much easier to find many facts. Another advantage is the ability to analyse data at several levels of detail.Here is an example of data visualization from the "Republic of Letters". Researchers map thousands of letters exchanged in the 18th century and can learn very rapidly what it once took a lifetime of study to comprehend.
We deal with visualization at every step of our lives. Graphic representation is used on television, in the press and in any other source of information (excluding radio stations) whenever there is numerical data. Visualization is necessary when we want to show a certain currency rate at a certain time (linear chart), election results (histograms) or the weather forecast. However, these are not the only examples of graphic representation of data. While it can serve to make it easier to see certain properties, it also makes it easier to discover them. This above all applies to large data sets compiled over many years which can be used for subsequent research.
-