
Source: https://dataoneorg.github.io/Education//lessons/03_planning/L03_DataManagement_Handout.pdf
0%
MOOC Basics of managing and sharing research data
Section outline
-
The scientific world has embrace digital technology in its research, publication and communication practices. It is now technically possible to open up science to the greatest number of people, by providing open access to publications and - as far as possible - to research data.
This course introduces you to the challenges of Research Data Management and sharing (RDM) in the context of Open Science (OS).
It was created within the framework of the Erasmus+ Oberred project in 2019. Other courses from the Oberred project are available on this platform.
OBERRED project
This course was carried out in the context of the Oberred project, co-funded by the Erasmus+ Programme of the European Union.

Oberred is an acronym for Open Badge Ecosystem for the Recognition of Skills in Research Data Management and Sharing. The aim of the Oberred project is to create a practical guide that includes the technical specifics and issues of Open Badges, roles and skills related to RDM, and principles for the application of Open Badges to RDM.
Find out more about the Oberred project here: http://oberred.eu/
This course is open access!
No account creation or registration is required, however you will only be able to browse it in read-only mode.
To participate in the activities (exercises, forum...) and get the badge(s), you must register for the course.
Register for the course For optimal use of this course, we recommend using the Google Chrome browser.
-
Course structure
This first lesson is an introduction to Research Data Management. It will enable you to grasp the context in which research data management takes place and give you an overall vision of the stakes involved in opening up and sharing such data.
- Data and society
- Data and science
- Science and society : Covid-19 example
- Open science and RDM
- Evaluation1
The second lesson will enable you to better understand the different steps of research data management, and to know the practices to be implemented and the tools to be used.
- Understanding the data life cycle
- FAIR principles
- Data Management Plan (DMP)
- Legal and ethical aspects
- Metadata
- Persistents identifiers
- The 3 distincts stepsof data storage
- Reuse and valorisation of data
- Evaluation 2
 Learning objectives
This course should provide you with a good understanding of the context in which research data management and sharing takes place:
- What are the issues and benefits of controlled data management?
- What concepts are related?
- How is data management organized and which actors are involved?
-
-
-
The impact of these technologies on our lives is therefore vast and seems rather well accepted according to the 2017 Eurobarometer. “75% of respondents think the most recent digital technologies have a positive impact on the economy, 67% - on their quality of life, 64% - on the society. 76% who use Internet every day say the impact of these technologies on their quality of life has been positive, compared to 38% who never use the Internet.”
Source: European Commission, Attitudes towards the impact of digitisation and automation on daily life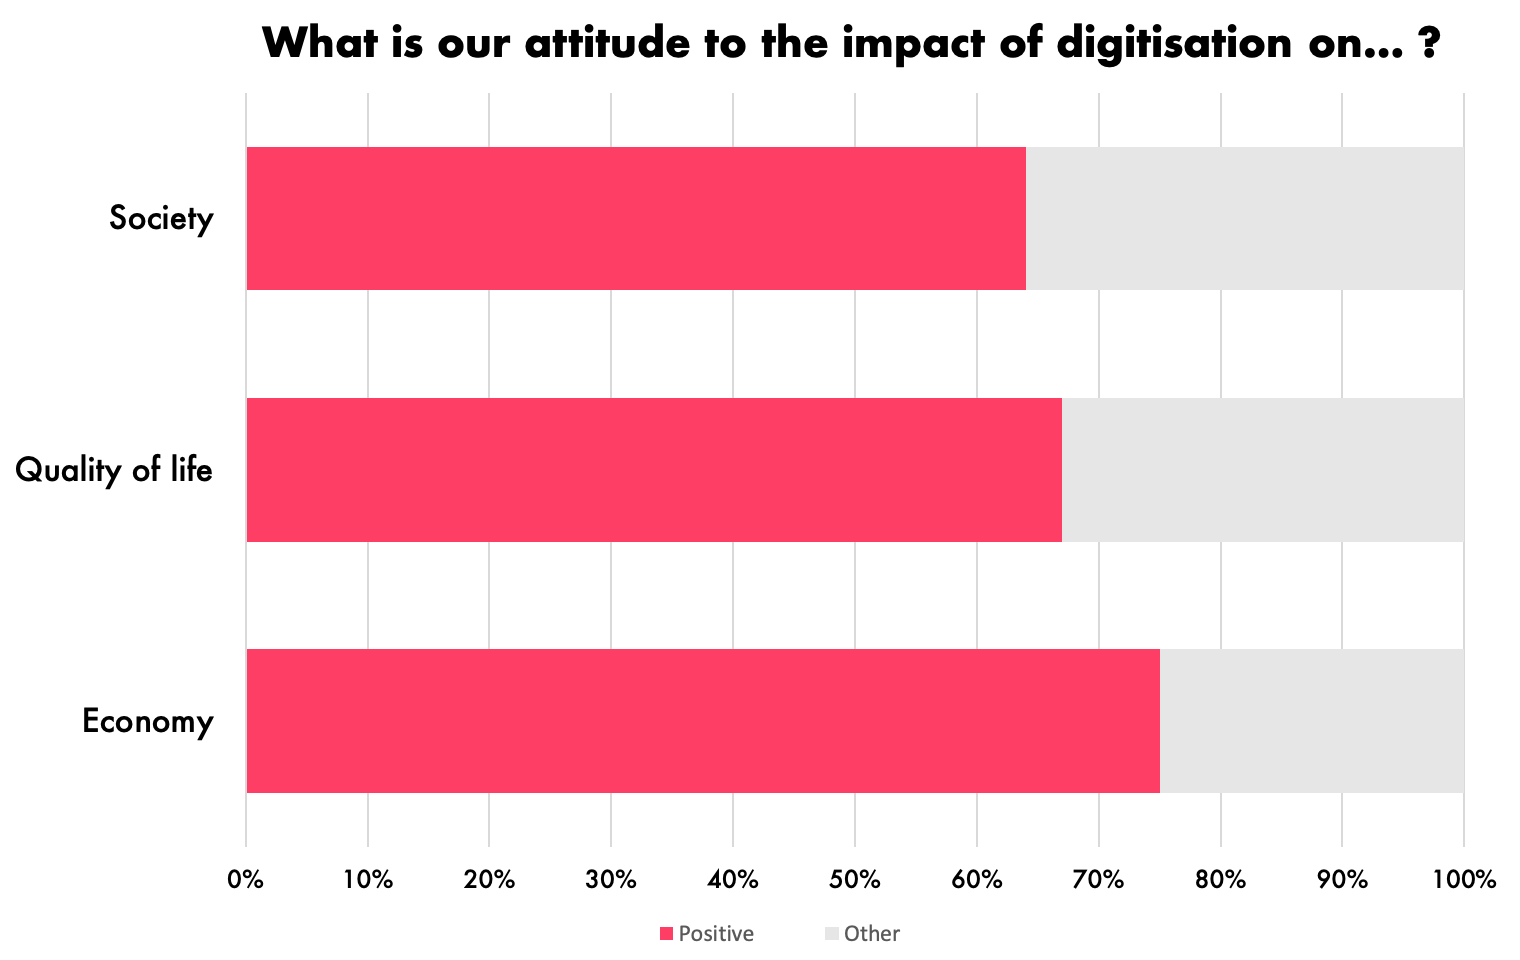
-
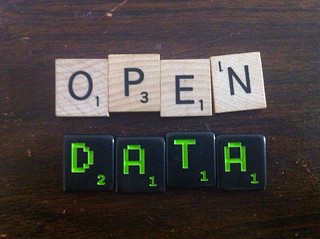
Open data. Opening of administrative and political data
Open data are freely accessible micro-data that can be used and reused freely by everyone. The term open data first appeared in 1995 in a document from an American scientific agency; it referred to the dissemination of geophysical and environmental data, but the idea that the empirical basis on which knowledge is built is a public good that should be available to all is much older.
-
Why data should be open?
2. Releasing social and commercial value: In the digital age, data is a key resource for social and commercial activities. Everything from finding your local post office to building a search engine requires access to data, much of which is created or held by government. By opening up data, government can help drive the creation of innovative business and services that deliver social and commercial value.1. Transparency: In a well-functioning democratic society citizens need to know what their government is doing. To do that, they must be able to freely access government data and information and share that information with other citizens. Transparency isn’t just about access, it is also about sharing and reuse — often, to understand material it needs to be analyzed and visualized and this requires the material to be open so that it can be freely used and reused.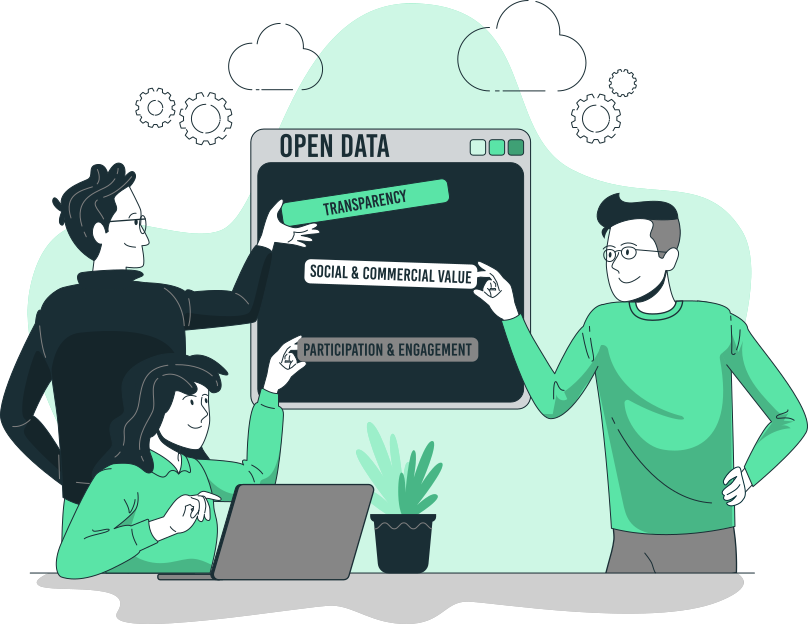 3. Participation and engagement: Participatory governance or, for business and organizations, engaging with your users and audience. Much of the time citizens are only able to engage with their own governance sporadically — maybe just at an election every 4 or 5 years. By opening up data, citizens are enabled to be much more directly informed and involved in decision-making. This is more than transparency: it’s about making a full “read/write” society — not just about knowing what is happening in the process of governance, but being able to contribute to it .
-
-
Evolution of science
The way science looks today differs greatly from the scientific practices of the past. The colossal amount of data and the tools for handling them have a dramatic effect on the way science is done.
Big Data is changing science in two ways:
- Science can gather increasing amounts of data from the society that may be used for analysis.
- Scientific activities themselves also produce larger amounts of data than ever before. Big data and science
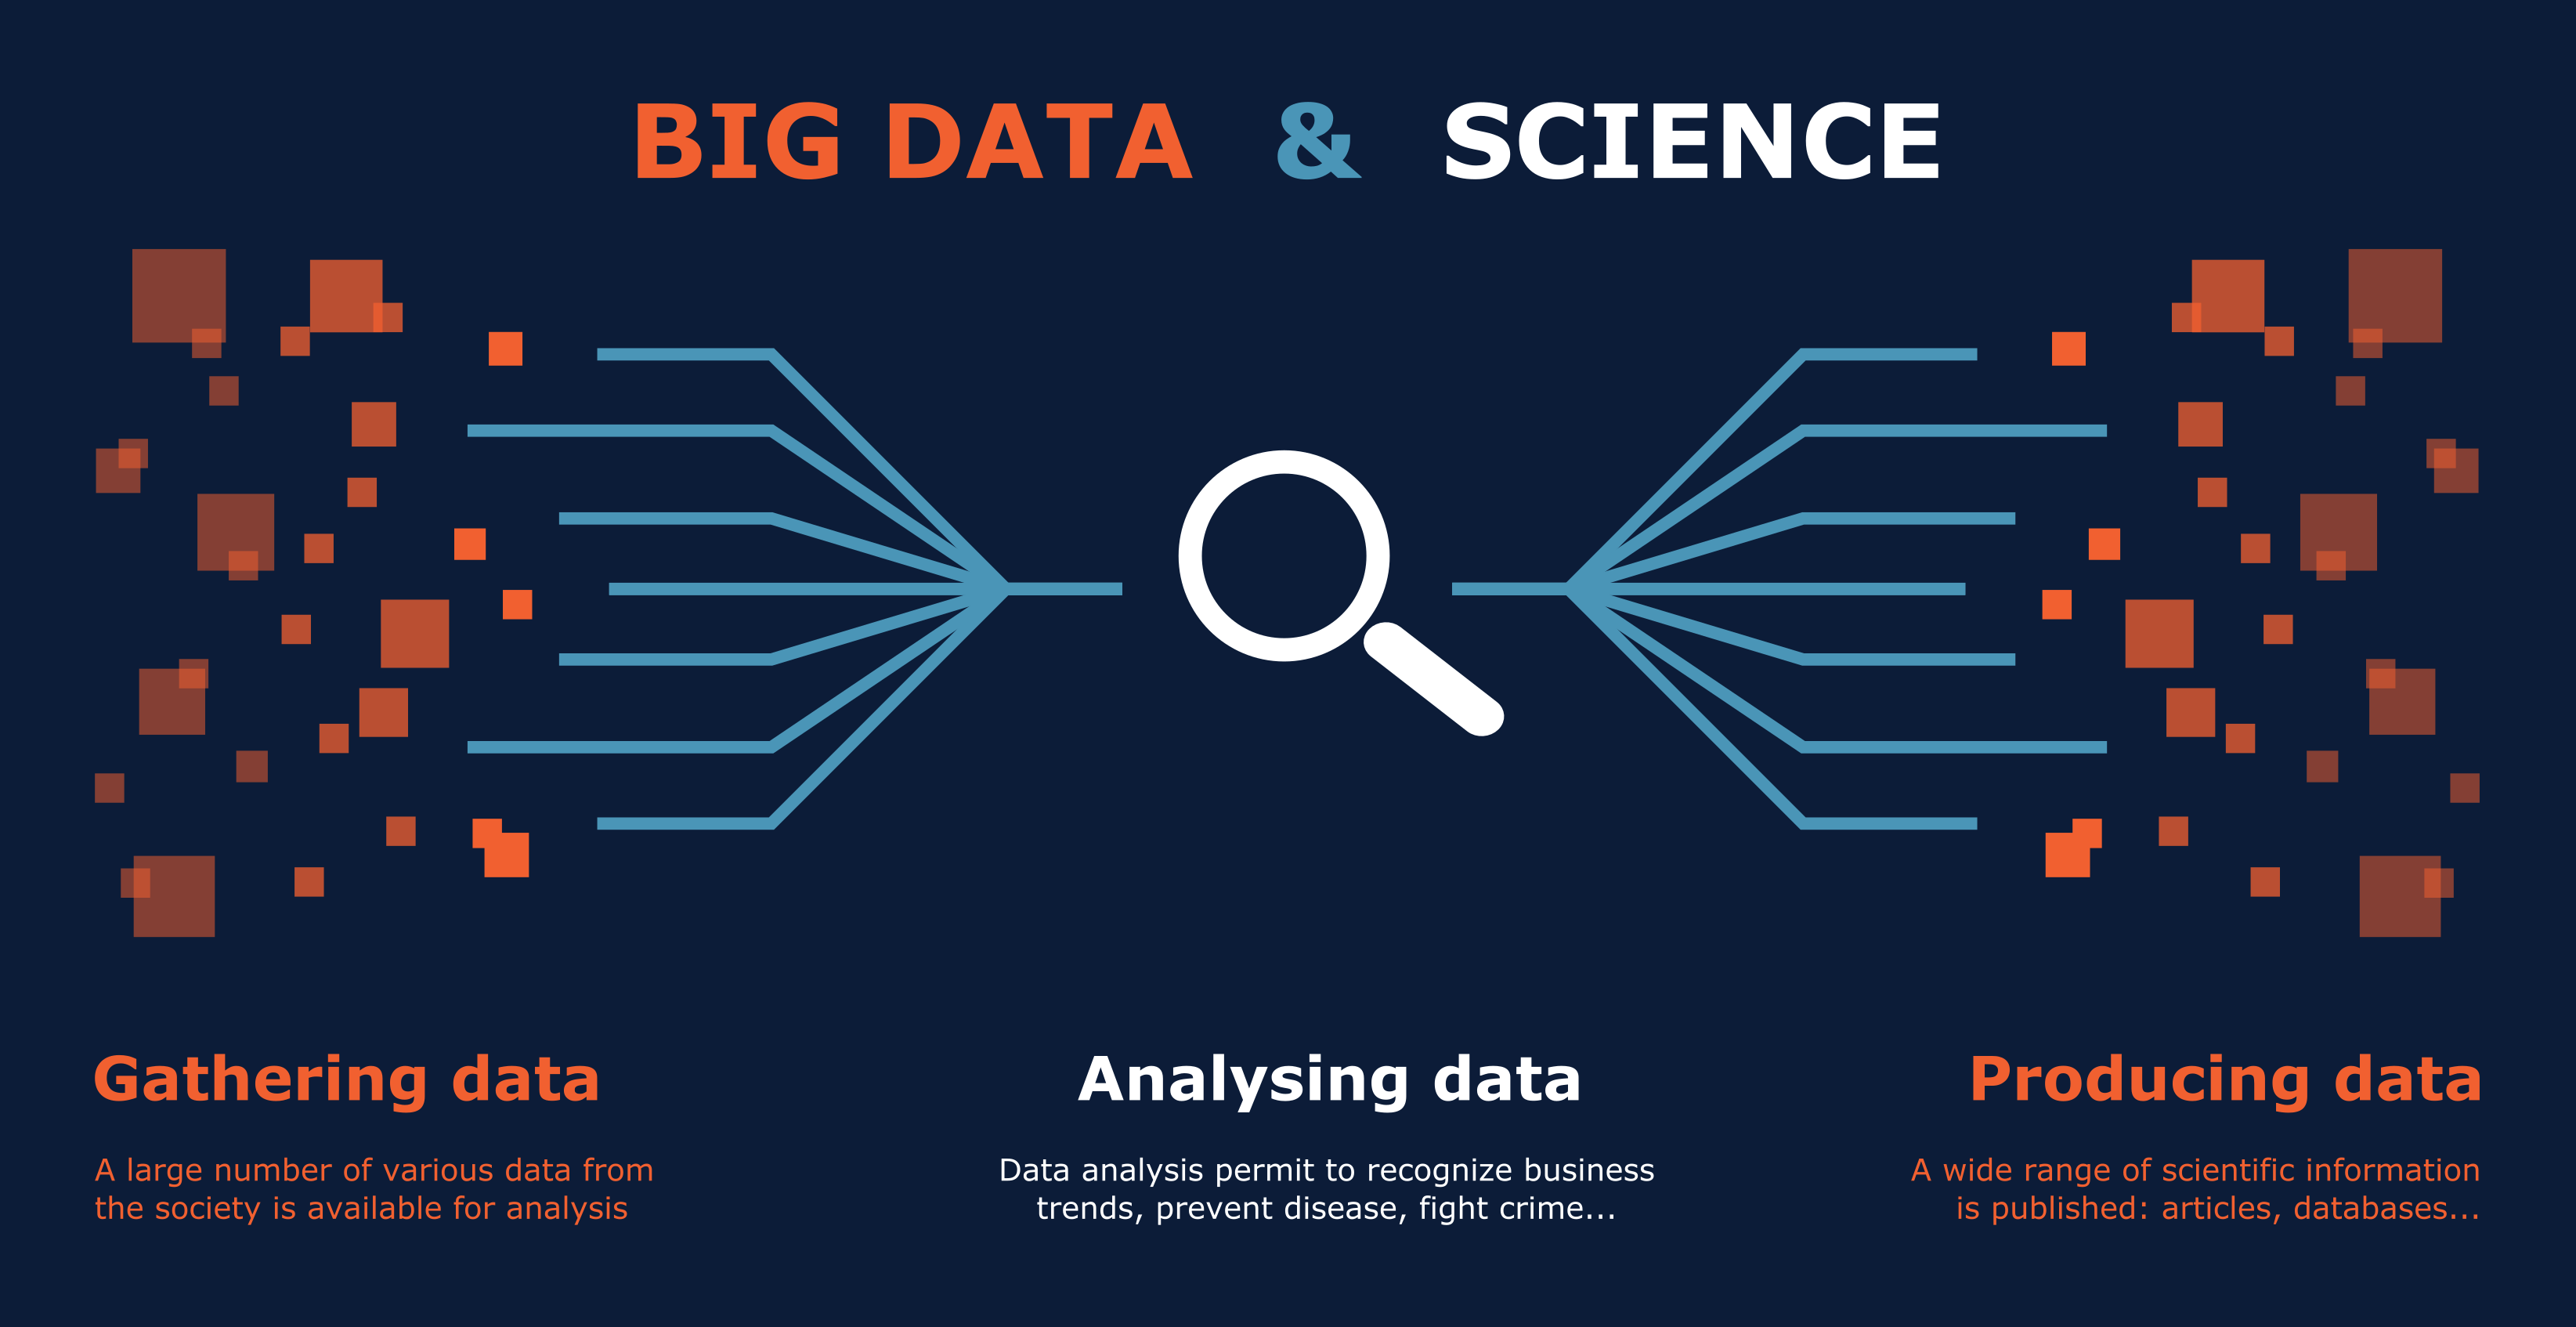
We live in a data-driven world. At any time we have access to a huge amount of digital information, which is growing daily. The increase in the amount of available data has opened the door to a new area of research based on big data - huge data sets that contribute to the creation of better operational tools in all sectors as well as develop scientific research. -
 By Calvinius — Personal work: http://www.martingrandjean.ch/wp-content/uploads/2013/10/HumanitesNumeriques.jpg, CC BY-SA 3.0, https://commons.wikimedia.org/w/index.php?curid=29275453
At the beginning, the digital humanities were mainly curating and analyzing data that were born analogue (texts, objects and images) but subsequently archived into digital forms that could be searched for automated guide analysis and visualization. Today, digital humanities consist of the use of sophisticated tools of curating and sharing data, augmenting the scale of research across a more vast range and volume of sources. Rather than concentrating on a basket of sources to analyze, it becomes possible to manage thousands of cultural products (paintings, books, photos, articles, etc.). Counting, classifying, graphing and mapping these data may offer new insights and raise interest in humanities as a field of science.Some common practices in Digital Humanities are Text and Data Mining and Data visualization.
By Calvinius — Personal work: http://www.martingrandjean.ch/wp-content/uploads/2013/10/HumanitesNumeriques.jpg, CC BY-SA 3.0, https://commons.wikimedia.org/w/index.php?curid=29275453
At the beginning, the digital humanities were mainly curating and analyzing data that were born analogue (texts, objects and images) but subsequently archived into digital forms that could be searched for automated guide analysis and visualization. Today, digital humanities consist of the use of sophisticated tools of curating and sharing data, augmenting the scale of research across a more vast range and volume of sources. Rather than concentrating on a basket of sources to analyze, it becomes possible to manage thousands of cultural products (paintings, books, photos, articles, etc.). Counting, classifying, graphing and mapping these data may offer new insights and raise interest in humanities as a field of science.Some common practices in Digital Humanities are Text and Data Mining and Data visualization. -
Text and Data Mining
Text mining, or Text and Data Mining (TDM), is a field which, with the use of appropriate tools, deals with text analysis, exploration, preparation of summaries, clustering and categorisation of documents, finding groups of words with similar meaning or automatic recognition of complex expressions.
By using text-mining methods it is possible to obtain data from the text that are suitable for quantitative statistical analysis. Using text mining represents a completely different approach to text data. They are no longer treated as purely qualitative data, but as a specific source of quantitative data - above all, on the frequency of occurrence of individual words in the analysed text. Text mining allows relatively automated searches of very large portions of text for keywords, their density and so on. This makes it possible to apply new methods of data analysis and to obtain new types of information concerning, among other things, the nature of the analysed texts or the variation in the frequency of keywords over time. Gabriel Gallezot, Marty Emmanuel. Le temps des SIC. MIÈGE, Bernard, PELISSIER, Nicolas et DOMENGET. Temps et temporalités en information-communication: Des concepts aux méthodes., L’Harmattan, pp.27-44, 2017, 10.5281/zenodo.1000778. sic_01599944
-
Data visualization
This modernised technology (and at the same time methodology) is increasingly present in every sphere of human activity: from research and development to business, social activities and art. It offers practical knowledge of how to graphically "master" huge sets of data that describe a given aspect of reality.
The purpose of data visualization is to show information in a way that allows its accurate and effective understanding and analysis. This is because people easily recognize and remember the images presented to them (shape, length, construction etc.). Thanks to visualization we can combine large data sets and show all the information at the same time, which greatly facilitates analysis. We can also use visual comparisons, thanks to which it is much easier to find many facts. Another advantage is the ability to analyse data at several levels of detail.Here is an example of data visualization from the "Republic of Letters". Researchers map thousands of letters exchanged in the 18th century and can learn very rapidly what it once took a lifetime of study to comprehend.
We deal with visualization at every step of our lives. Graphic representation is used on television, in the press and in any other source of information (excluding radio stations) whenever there is numerical data. Visualization is necessary when we want to show a certain currency rate at a certain time (linear chart), election results (histograms) or the weather forecast. However, these are not the only examples of graphic representation of data. While it can serve to make it easier to see certain properties, it also makes it easier to discover them. This above all applies to large data sets compiled over many years which can be used for subsequent research.
-
-
-
The social media, science and politics: how COVID-19 made science processes mainstream
The recent COVID-19 pandemic has highlighted the long-standing need for more openness in science. This includes collaboration, knowledge-sharing, and exchange of ideas. A major aspect of this phenomenon has been the need for open research data in order to “accelerate the pace of research critical to combating the disease” (source: Why open science is critical to combatting COVID-19).
The emergence of the new virus that we knew very little about put an enormous pressure on the governments to make quick decisions based on scarce data.
Moreover, public opinion was swayed by the fake news, emerging discussions by non-experts - including celebrities - on social networks as well as a number of harmful conspiracy theories.
 As this global crisis shows, the world of science cannot be perceived as an ivory tower. Instead, we need to see scientists as important actors who interact both with societies and with politicians in an active fashion.
They need to be actively involved in the public debate, present their research results in an accessible way and offer recommendations for public policy. -
Consequences
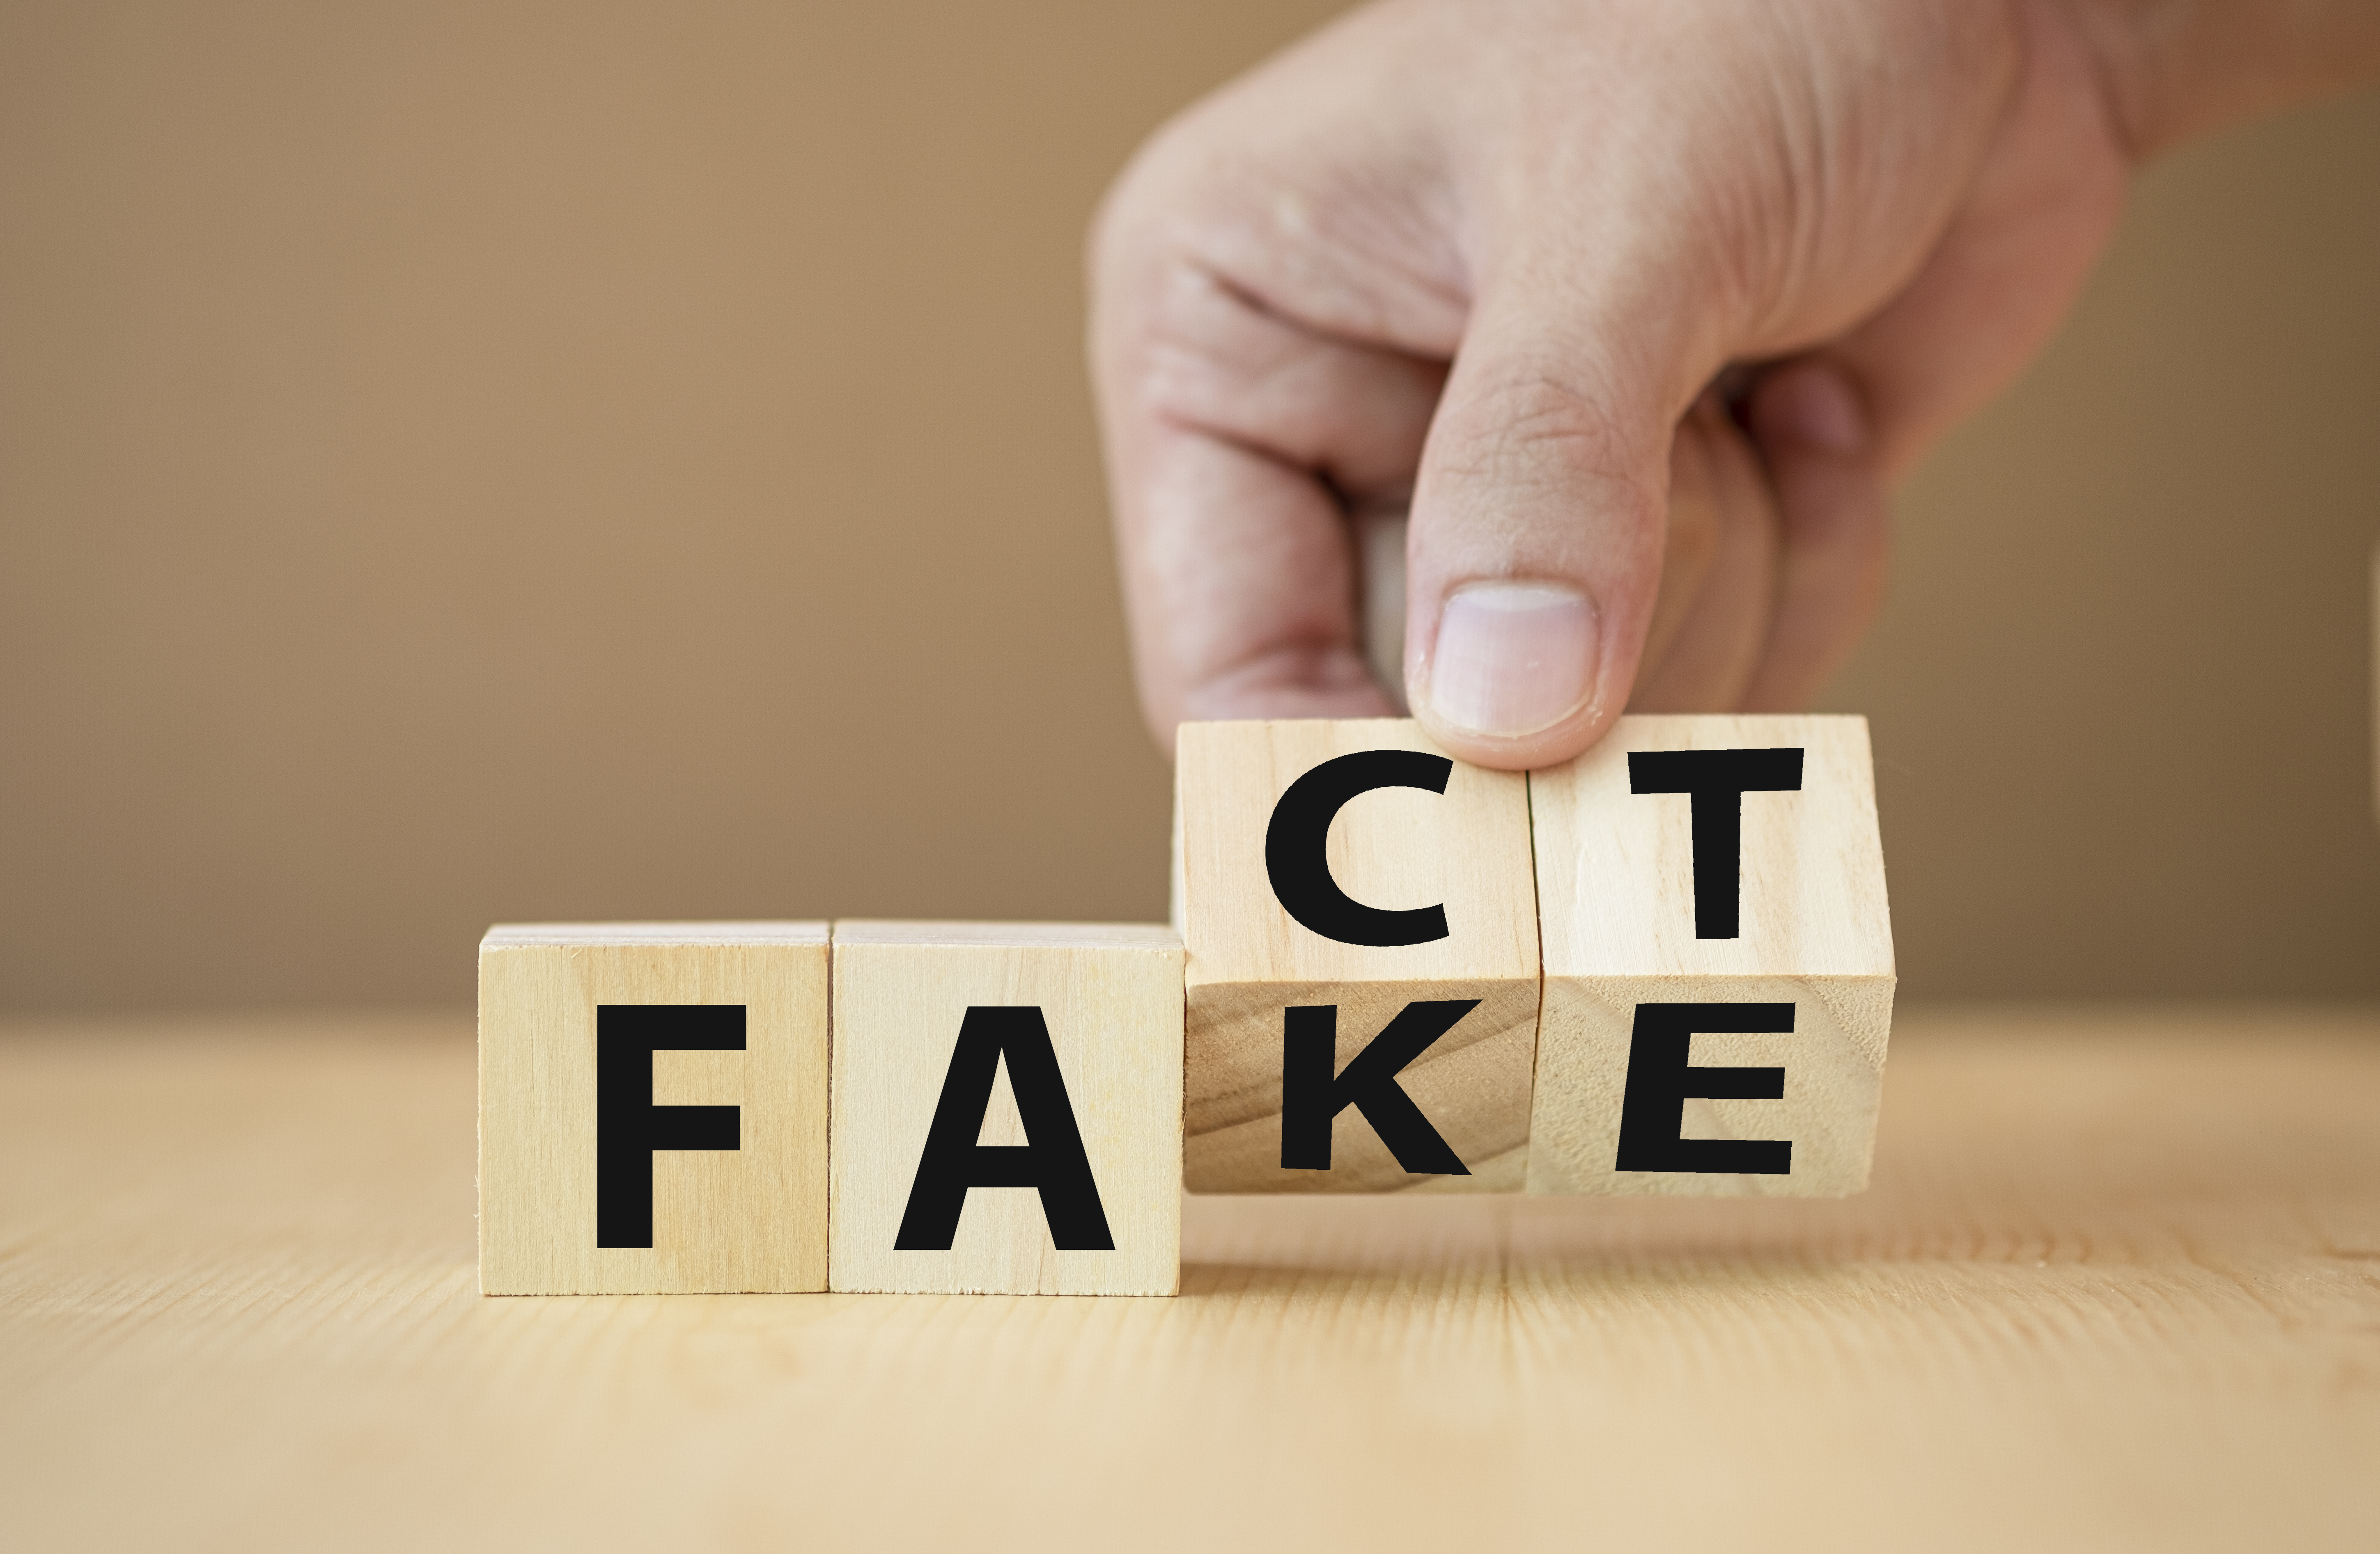
This appears undoubtedly as a major scandal in the field of medical research. It is all the more acute because it concerns an emergency situation - a pandemic caused by a previously unknown virus, which, of course, causes fear, but is also connected with the rise of conspiracy theories and the appearance of fake news. Currently, we are facing not only the health and economic consequences of a pandemic caused by a new coronavirus, but also - as many experts emphasize - an equally dangerous phenomenon accompanying it. This is the so-called infodemic which is a flood of false or misleading information about the virus, disease, etc.
This phenomenon is intensified especially in a situation where scientific publications and experts have been discredited and part of the society has stopped trusting them.
Also, hasty political decisions were made as a result of blind faith in scientific publications. The consequences turned out to be catastrophic, and eventually the WHO decided to "restart" research programs on hydroxychloroquine.
The issue concerns the basic principles that should govern science: transparency and rigorous evaluation of results before publication. In this case, both elements were missing.
-
 At the same time, however, the positive aspects of this situation should be noted. As a consequence, the general public was acquainted with the issues and problems of scientific publications. Moreover, for the first time the issue of open access to data, as well as sharing and managing it, has reached such a large group of people not involved professionally in scientific research. As a result of this case, a large part of the society began to take an interest in the issue of accessibility to data and could understand its importance not only in modern science but also in everyday social life.
-
-
-
Test your knowledge on this first part of the introduction to data management and sharing.
Success in this test is rewarded by an Open Badge! To pass this test, you must be enrolled in the course
Check
-
-
-
What is the source of the data?

Observation data
Observation data are captured in real time. They are captured by observing a behaviour or activity and are therefore most often unique and impossible to reproduce. This is the case with sensor data, neuroimaging, astronomical photography or survey data.

Experimental data
Experimental data are obtained from laboratory equipment. They are often reproducible but this can be costly. Chromatographs and DNA chips fall into this category.

Computational or simulation data
Computational or simulation data are generated by computer or simulation models. They generate more important metadata. They are often reproducible provided that the model is properly documented. For simulations data, the test model wich is used is often as important than the data generated from the simulation and sometimes even more so. Examples include meteorological models, seismic simulation models and economic models.
Derived or compiled data
Derived or compiled data are derived from the processing or combination of raw data. They are often reproducible but expensive. This is the case for data obtained by text mining, 3D models or compiled databases.

Reference data
Collection or accumulation of small datasets that have been peer reviewed, annotated and made available.
-
What form does this data take?
 Textual data : Field or laboratory notes, survey responses...
  Digital data : Tables, measures...
 Audiovisual data : Images, sounds, videos…
 Computer codes
 Discipline-specific data : For example FITS in spatial data or CIF in crystallography...
 Specific data produced by some instruments
 -
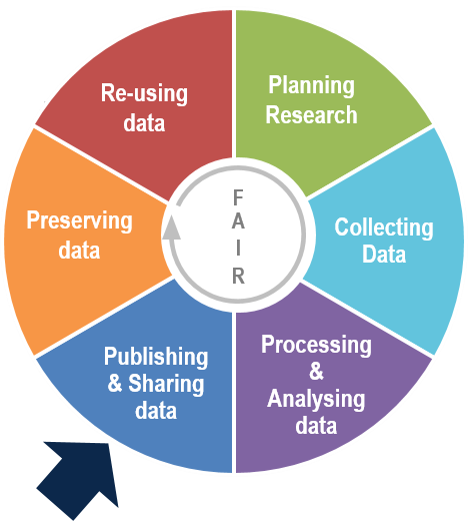
4. Research Data Life Cycle
The data life cycle is the set of steps involved in the management, preservation and dissemination of the research data, associated with research activities. This cycle guides researchers through the research data management process to enable them and their stakeholders to make the most of the research data generated.Source : DoRANum
It can be divided into six different phases: Planning, Collecting, Analysing, Publishing, Preserving, and Reusing.
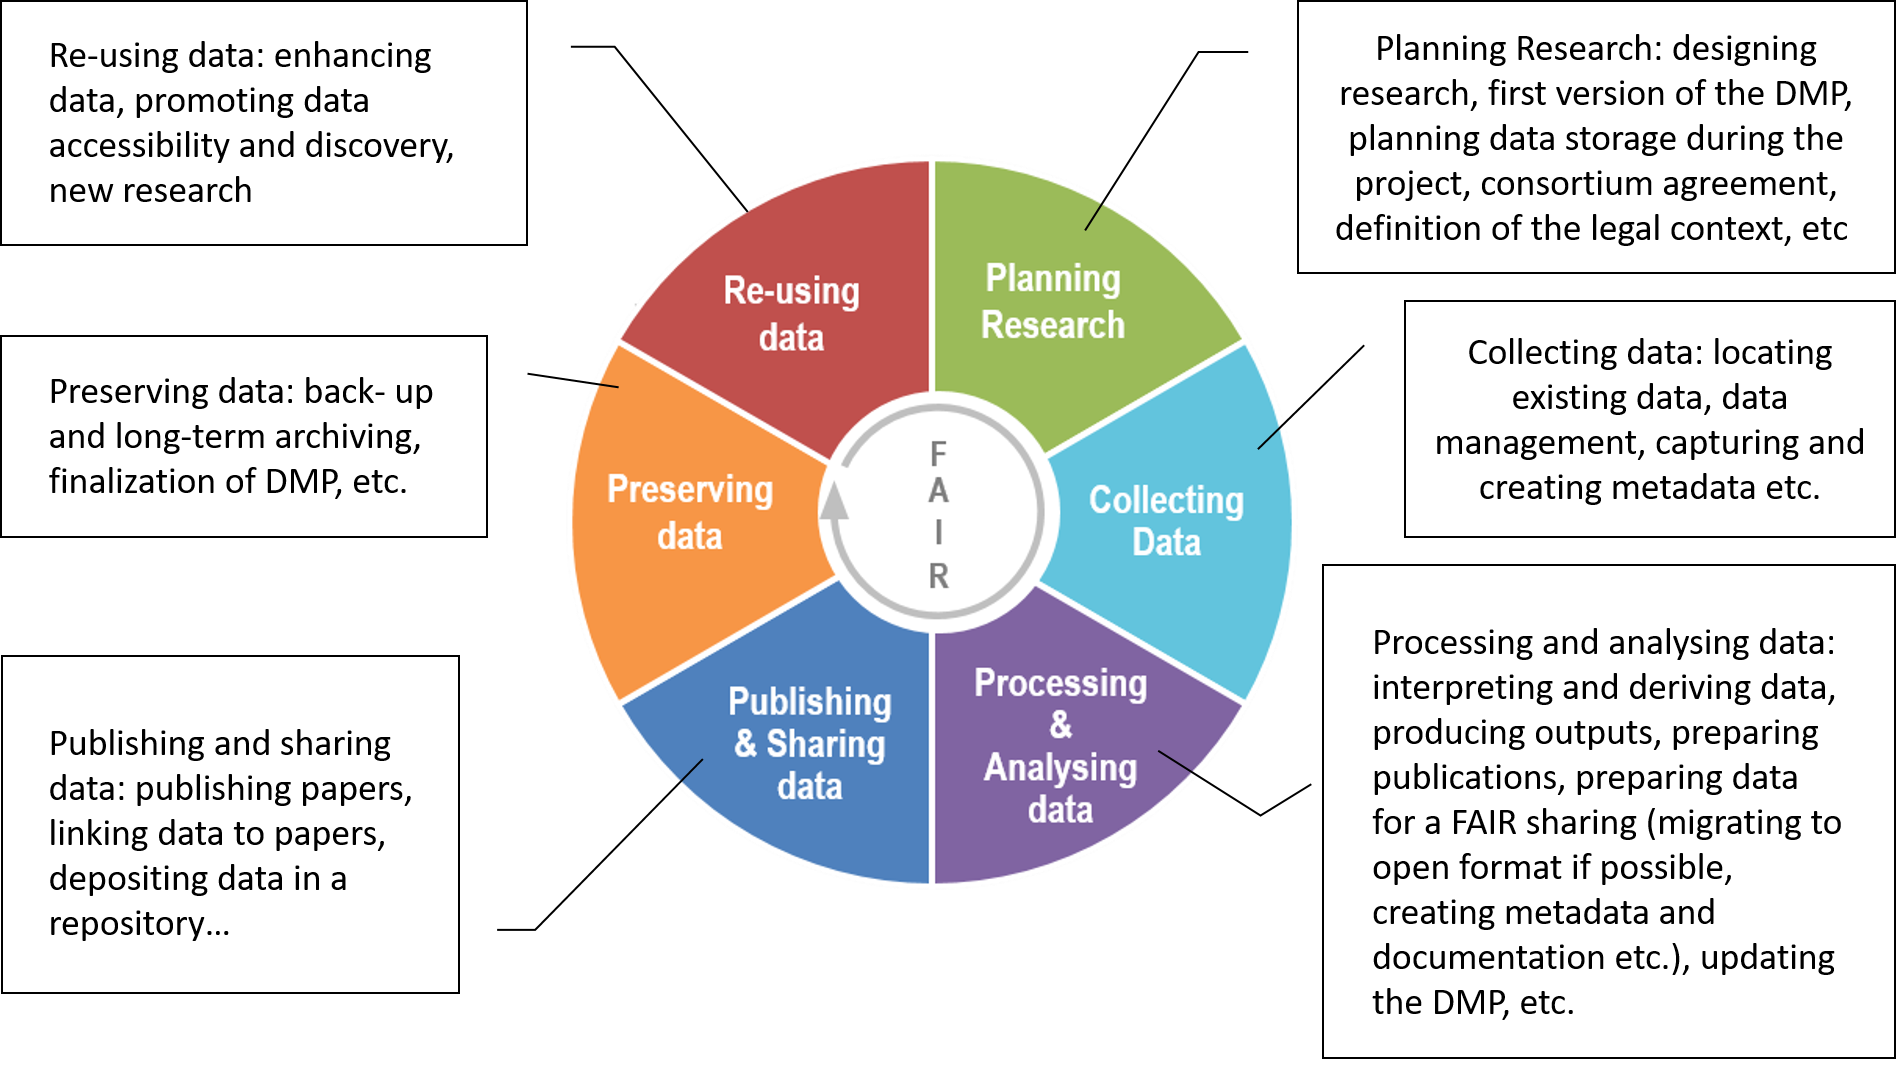
Source : Adaptation of Research data lifecycle – UK Data Service
-
-
1. Definition
It’s recommended to respect the 4 FAIR principles in order to ensure an optimal use of research data and associated metadata, both by people and by machines.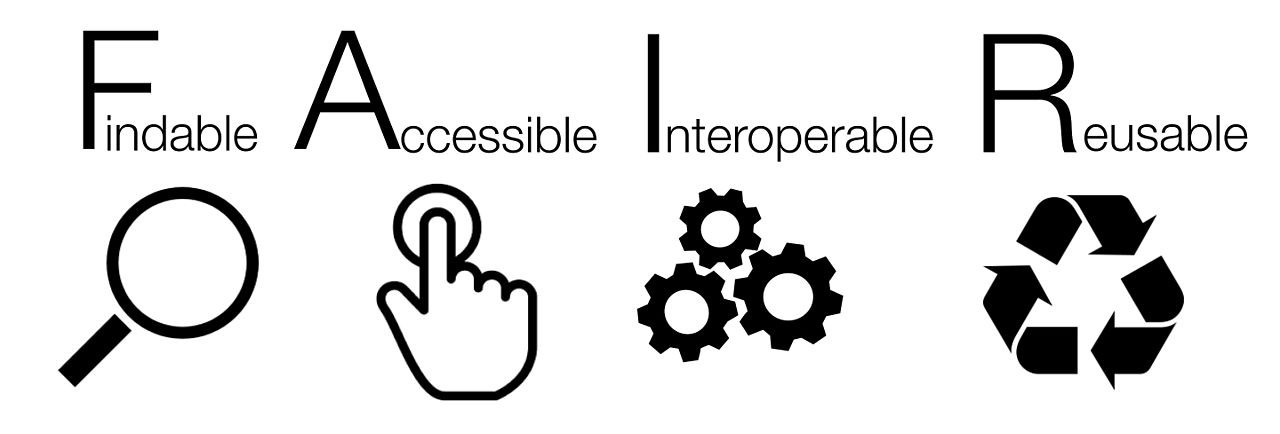
By SangyaPundir — Personnal work, CC BY-SA 4.0
FAIR data are those that are Findable, Accessible, Interoperable and Reusable.
What do each of these terms mean in a practical sense and how can you tell if your own research data is FAIR?
-
-
-
1. Definition
DMP means Data Management Plan. It is a management tool structured in headings wich synthesize the description and evolution of data sets during your research project. it allows to prepare the sharing, reuse and long term preservation of dataSource: DoraNum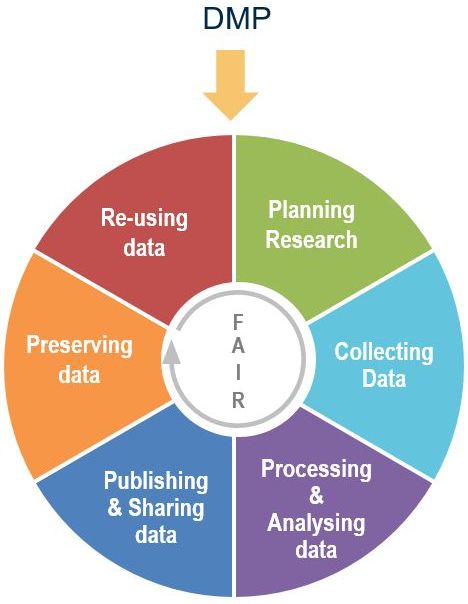
-
4. DMP: a project management tool
It is an evolving, dynamic and continuously updated document (introduction of a new dataset, patent deposit, changes in the consortium...). It is also a project management tool that facilitate the organization and description of data. It allows to define responsibilities, resources and produce FAIR data.
 Data Organization
The DMP helps to organize data well throughout the project.
Evolving Document
Start drafting the DMP from the beginning of the project, with already known or planned elements. Then complete the DMP progressively. Plan for at least 2 versions: at the beginning and end of the project. For projects longer than 30 months, an intermediate version is required.
 Data Description
In the DMP, describe how data will be obtained, processed, organized, stored, secured, preserved, shared... (data lifecycle). Responsibilities
In the DMP, designate the person(s) responsible for data management for all project stages and within the partnership if applicable: data entry; metadata production; data quality control; data storage, sharing and archiving; DMP updating. Individuals can be named specifically or a function can be indicated if the person occupying it might change during the project. Resources
Evaluate the necessary resources (budget, allocated time, personnel) to implement the actions described in the DMP: Time needed to prepare data for storage, sharing and archiving; equipment costs and personnel remuneration; storage costs (dedicated servers, processing, maintenance, security, access...), sharing costs (website, publication...) and data archiving expenses. Reliable Data
The DMP allows data producers to ask themselves the right questions and thus improve the reliability of their data.
DMP contribute to initiate very early a collective work on good practices and to anticipate questions related to data management (such as the choice of a repository, how to document the data ...).
-
-
3. Data accessibility
There are several ways to limit access to your data:
Access
Depending on the progress of the research project, access modalities may differ. During the project, it may be necessary, or even crucial, to limit data access to research team members only. Once the project is completed, it can be equally important to limit data access. Four modes of data access are distinguished: open, with embargo, restricted, and closed. Depending on the desired access mode, different modalities can be implemented:
- password,
- access limited to certain people (to consortium members or a scientific community, for example) time-limited,
- access with an embargo.

Security

Data itself can be secured through:
- encryption
- pseudonymization
- anonymization.
Particular attention must be paid to sensitive data and personal data!
Attention, pseudonymized does not mean anonymized! Unlike anonymization, which is an irreversible action, pseudonymization is reversible and can therefore potentially allow the identification of a natural person.It is recommended to use encryption of your sensitive data to prevent hacking.
-
-
Without metadata

Source : picture by Araceli Jáuregui from Pixabay
With metadata

Source :picture by heberhard from Pixabay
-
2. Metadata in the data life cycle
It is recommended to complete the metadata as the project progresses, with particular attention to:
- the step of data sharing,
- the step of persistent archiving (specific metadata will have to be added).

-
5. Examples of metadata standards


Standard linked to the attribution of persistent DOI identifiers. https://schema.datacite.org/
Disciplinary standard for the domain of social, behavioral, and economic sciences.Metadata standard for structural sciences domains (chemistry, materials science, earth sciences, biochemistry). http://icatproject-contrib.github.io/CSMD/
Disciplinary standard in the biodiversity domain. http://rs.tdwg.org/dwc/
Disciplinary standard in the ecology domain: it was largely designed to describe digital resources. It can also be used to describe non-digital resources such as paper maps or other media. https://eml.ecoinformatics.org/
Disciplinary standard in the architecture domain. https://historicengland.org.uk/images-books/publications/midas-heritage/
International standard for describing geographic information and services. https://www.iso.org/standard/53798.html
-
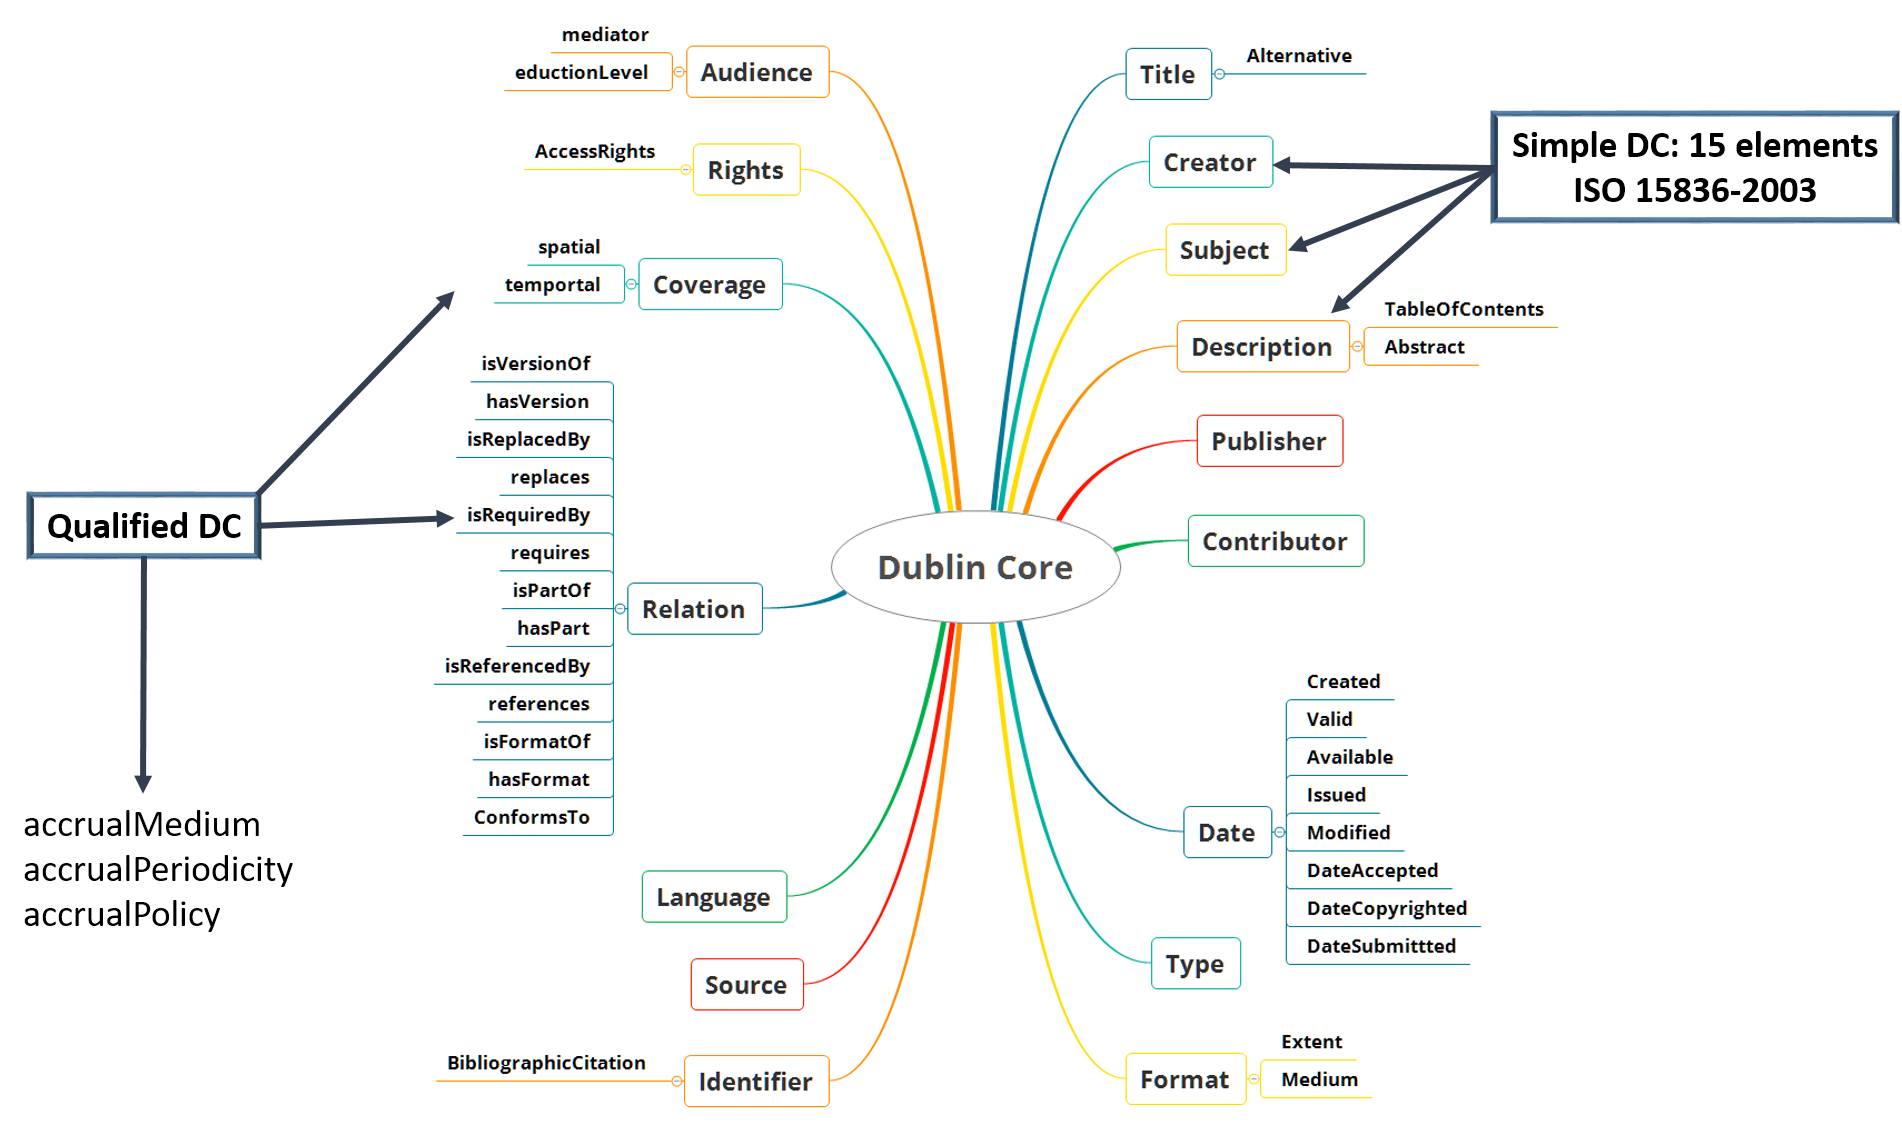
6. Focus on the international Dublin Core standard
The Dublin Core is a widely used international and multidisciplinary standard. Moreover, it is often the base of disciplinary or specific data standards. It contains 15 elements that constitute the minimum required:
- elements related to content
- elements related to intellectual property.
Dublin Core Metadata Element Set
"The original DCMES Version 1.1 consists of 15 metadata elements, defined this way in the original specification:
- Contributor – An entity responsible for making contributions to the resource
- Coverage – The spatial or temporal topic of the resource, the spatial applicability of the resource, or the jurisdiction under which the resource is relevant
- Creator – An entity primarily responsible for making the resource
- Date – A point or period of time associated with an event in the lifecycle of the resource
- Description – An account of the resource
- Format – The file format, physical medium, or dimensions of the resource
- Identifier – An unambiguous reference to the resource within a given context
- Language – A language of the resource
- Publisher – An entity responsible for making the resource available
- Relation – A related resource
- Rights – Information about rights held in and over the resource
- Source – A related resource from which the described resource is derived
- Subject – The topic of the resource
- Title – A name given to the resource
- Type – The nature or genre of the resource.”
Source: https://en.wikipedia.org/wiki/Dublin_Core
"The fifteen basic elements are considered as a common denominator and in most cases are not sufficiently precise. The basic elements have been extended (or specified) by a set of other terms called "qualifiers".
Two classes of qualifiers are recognized:
- element refinements that explain the meaning of an element;
- encoding schemes or controlled vocabularies."
Source: Extract translated from " Présentation des standards: le Dublin Core" by Elizabeth CHERHAL (Cellule MathDoc, UMS5638, CNRS/Université Joseph Fourier, Grenoble) - https://www.enssib.fr/bibliotheque-numerique/documents/1236-presentation-des-standards-le-dublin-core-dc.pdf
-
7. Focus on DataCite metadata schema

Content from DataCite Metadata Working Group. (2019). DataCite Metadata Schema Documentation for the Publication and Citation of Research Data. Version 4.3. DataCite e.V. https://doi.org/10.14454/7xq3-zf69
The Metadata Schema
DataCite’s Metadata Schema has been expanded with each new version. It is, nevertheless, intended to be generic to the broadest range of research datasets, rather than customized to the needs of any particular discipline.
DataCite Metadata Properties
There are three different levels of obligation for the metadata properties:- Mandatory (M) properties must be provided,
- Recommended (R ) properties are optional, but strongly recommended for interoperability and
- Optional (O) properties are optional and provide richer description.
Researchers who wish to enhance the prospects that their metadata will be found, cited and linked to original research are strongly encouraged to submit the Recommended as well as Mandatory set of properties. The properties listed in Table 1 have the obligation level Mandatory, and must be supplied when submitting DataCite metadata.Table 1: DataCite Mandatory Properties
ID Property Obligation 1 Identifier (with mandatory type sub-property) M 2 Creator (with optional given name, family name, name identifier and affiliation sub-properties) M 3 Title (with optional type sub-properties) M 4 Publisher M 5 Publication year M 10 Ressource type (with mandatory general type description sub-property) M
The properties listed in Table 2 have one of the obligation levels Recommended or Optional, and may be supplied when submitting DataCite metadata.
Table 2: DataCite Recommended and Optional Properties
ID Property Obligation 6 Subject (with scheme sub-property) R 7 Contributor (with optional given name, family name, name identifier and affiliation sub-properties) R 8 Date (with type sub-property) R 9 Language O 11 AlternateIdentifier (with type sub-property) O 12 RelatedIdentifier (with type and relation type sub-properties) R 13 Size O 14 Format O 15 Version O 16 Rights O 17 Description (with type sub-property) R 18 GeoLocation (with point, box and polygon sub-properties) R 19 FundingReference (with name, identifier, and award related sub-properties) O DataCite Properties
Table 3 provides a detailed description of the mandatory properties, which must be supplied with any initial metadata submission to DataCite, together with their sub-properties. [...] The third column, Occurrence (Occ), indicates cardinality/quantity constraints for the properties as follows:
- 0-n = optional and repeatable
- 0-1 = optional, but not repeatable
- 1-n = required and repeatable
- 1 = required, but not repeatable
Table 3
-
-
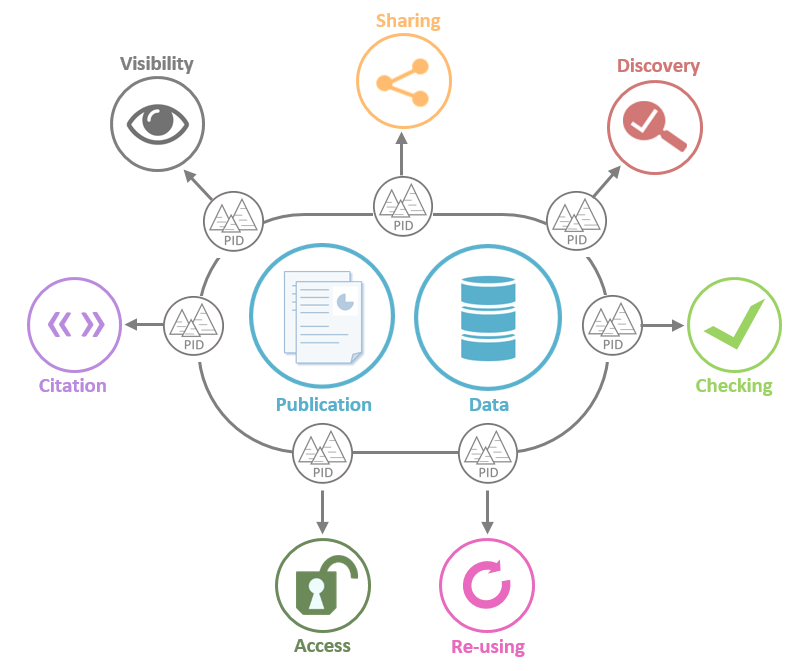
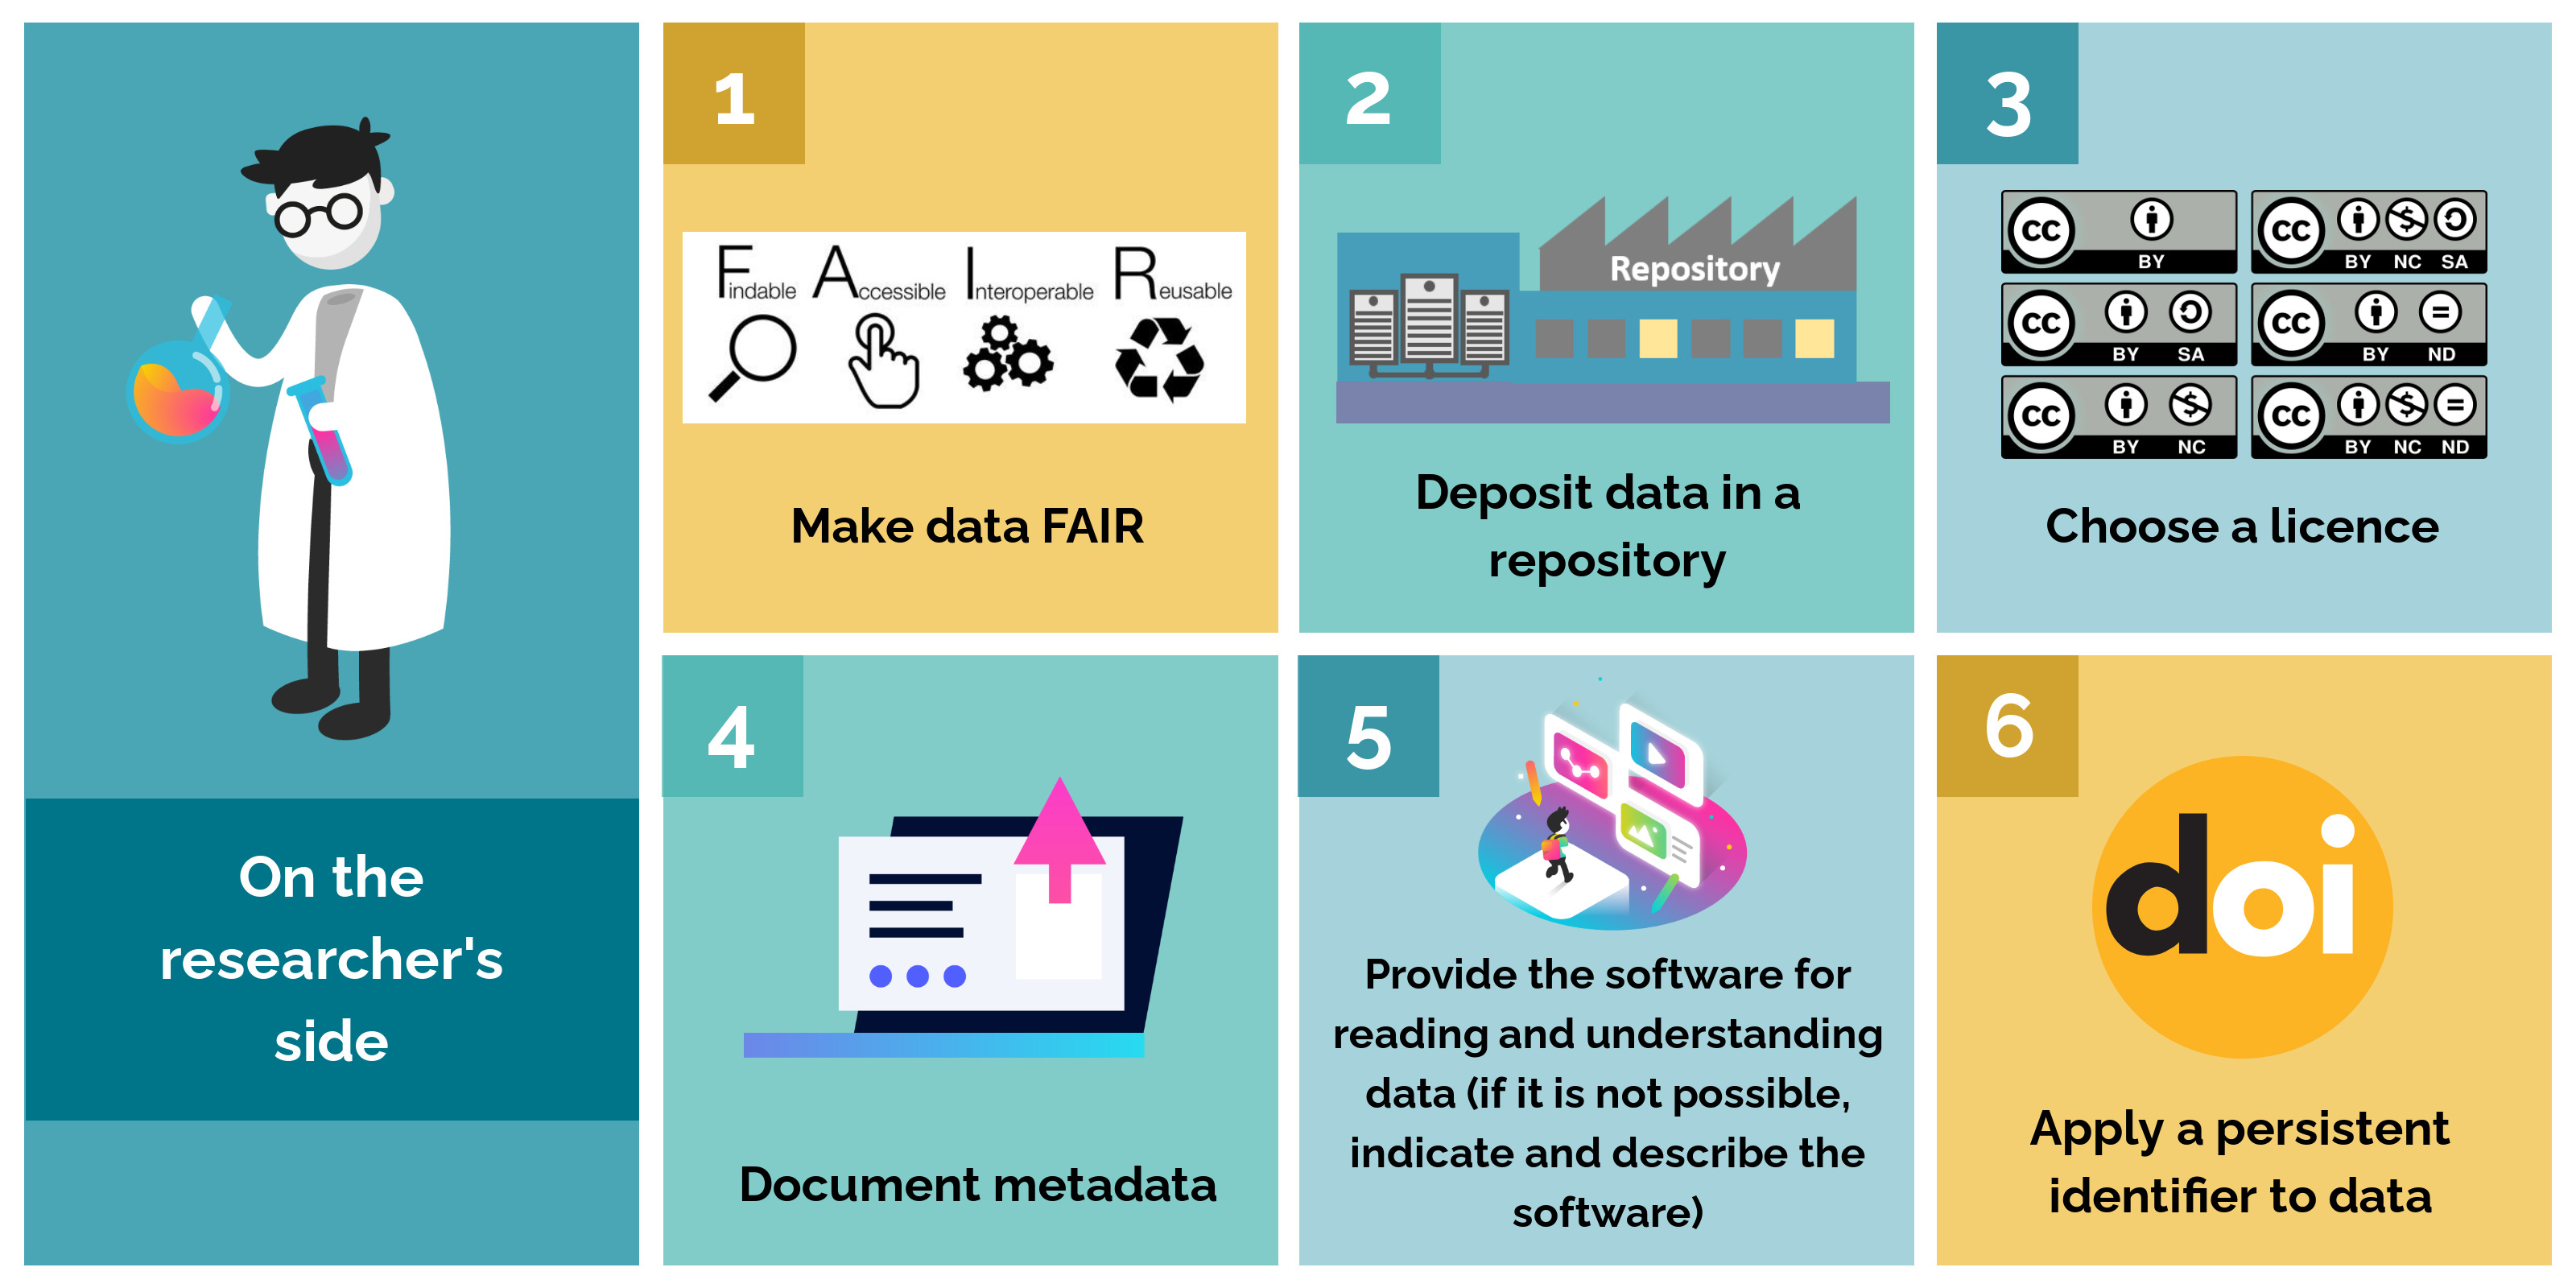
Persistent identifiers are assigned to the data at the sharing step.
Source: Adaptation of Research data lifecycle – UK Data Service -
1. Definition
An identifier is a unique association between an alphanumeric code and an entity or a ressource. On the web, ressources are located by URLs. However, these URL's are not stable. If the resource is moved and/or renamed, it is no longer accessible. The browser then displays the 404 error code. Persistent identifiers guarantee a stable link to the online resource. The persistency is obtained by an active management of URLs.
This management is ensured by recognized organizations, support by human and technical infrastructures. The identity of the resource is matched to its location on the web. The hypertext link access will be guaranteed and will never be broken.
The role of persistent identifier is to facilitate the tracking, to locate, access and cite the results of research production:
- Persistent identifiers allows a sure identification (to a resource, an author...).
- Persistent identifiers for publications and data allow to access them over the long term.
- They link published articles to the underlying data sets.
- They also help to discover, share, reuse and cite the results of research and scientific production.
Source : Doranum - Persistents identifiers
The ideal identification is a combination of several identifiers:
- PID for publications
- PID for data
- PID for authors
- PID for research organizations

Source : Doranum - Identifiants pérennes : FICHE SYNTHÉTIQUE
For publications, the attribution of a perennial identifier is a well-established and systematized procedure. Most publishers and open archives automatically assign a persistent identifier to each article. This is most often a Handle or DOI. The latter is assigned through the CrossRef agency.
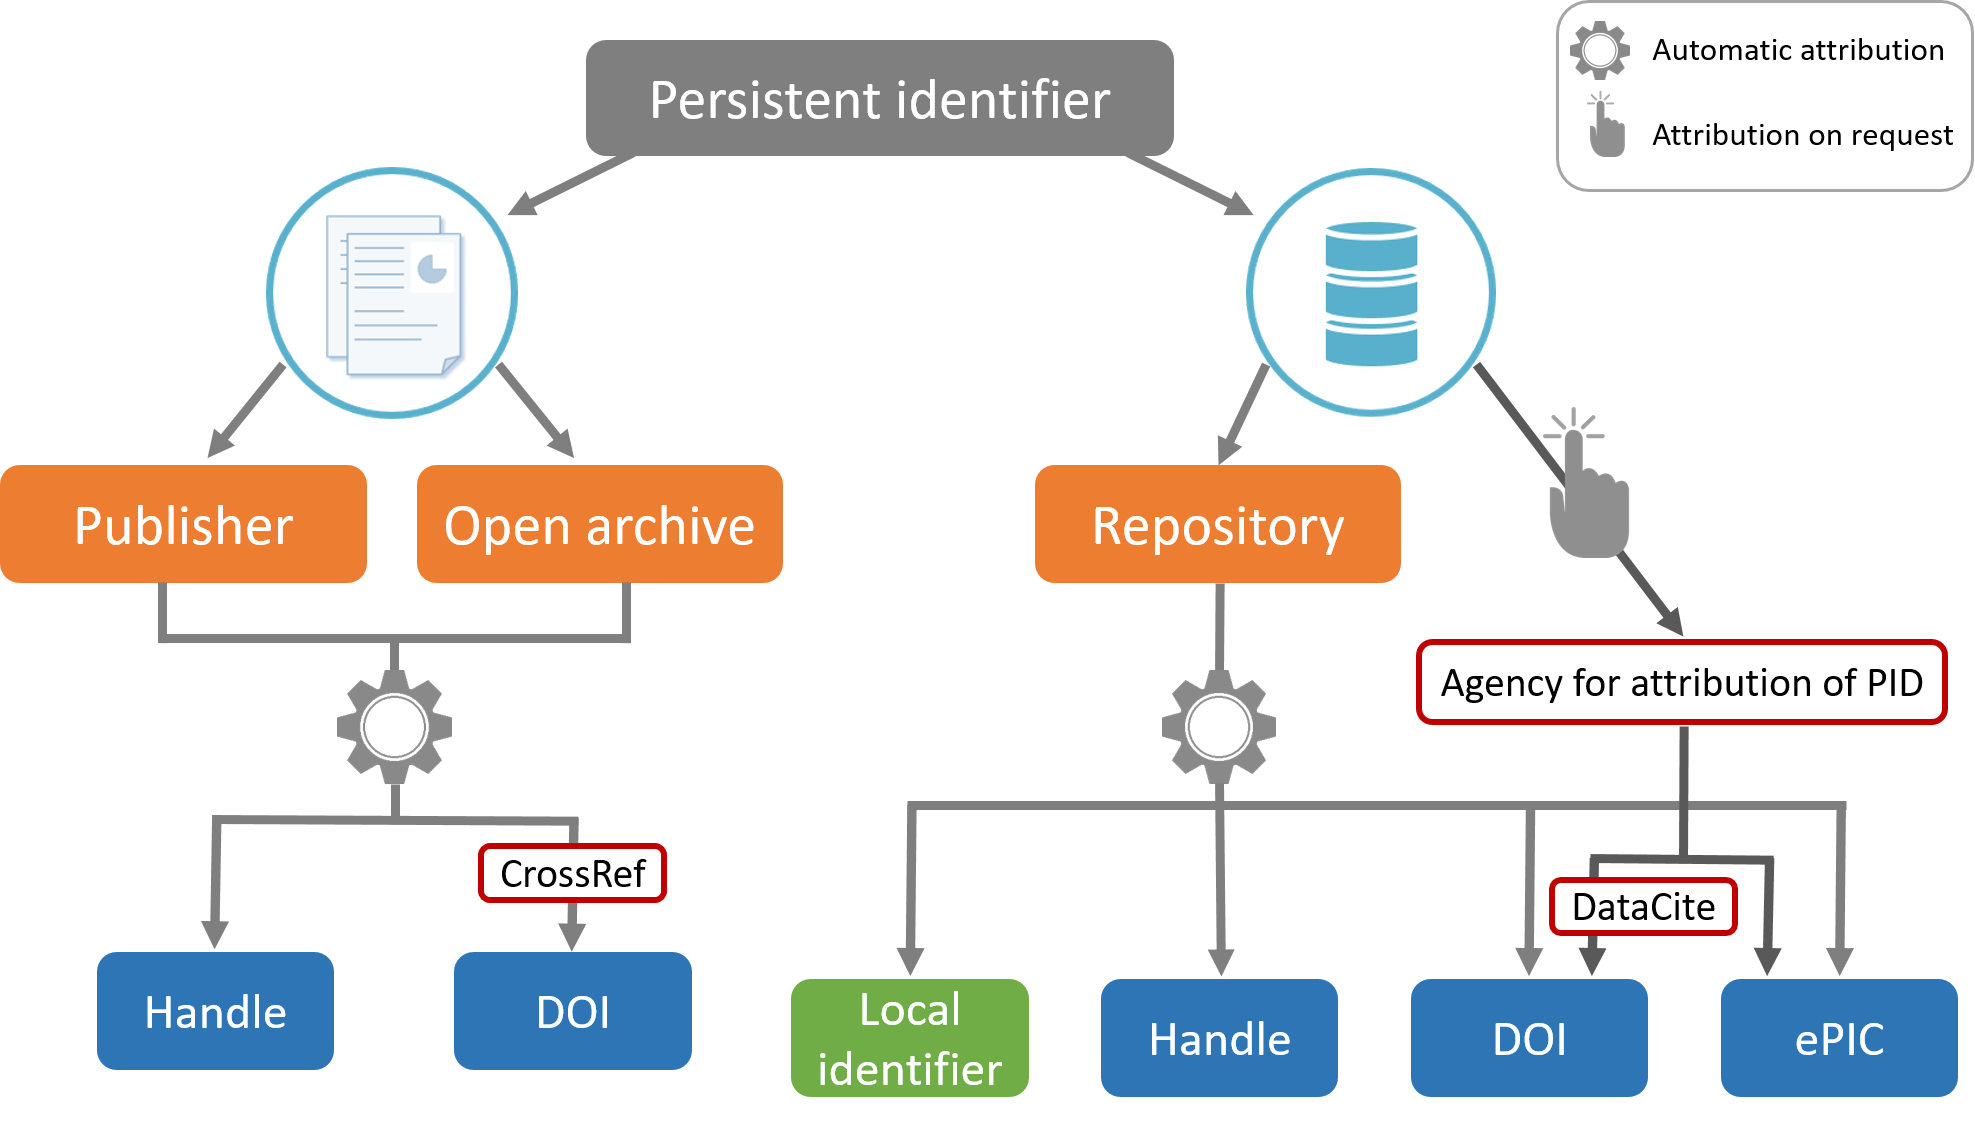
Source : Doranum - Les identifiants pérennes : un aperçu
Identifiers are often assigned to your data when they are deposited in a repository: it can be a local identifier, or a unique global identifier.
In this course, we will not talk about PID for publications.
-
-
-
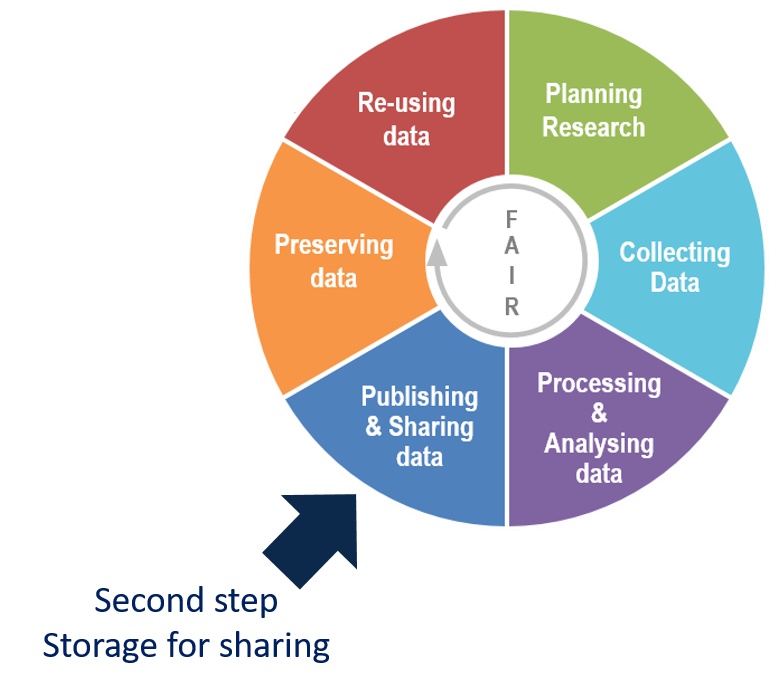
Storage and secure backup, sharing, long-term archiving occur at different steps of the data lifecycle, and have distinct functions.
Here is a scheme to understand the difference between these 3 steps: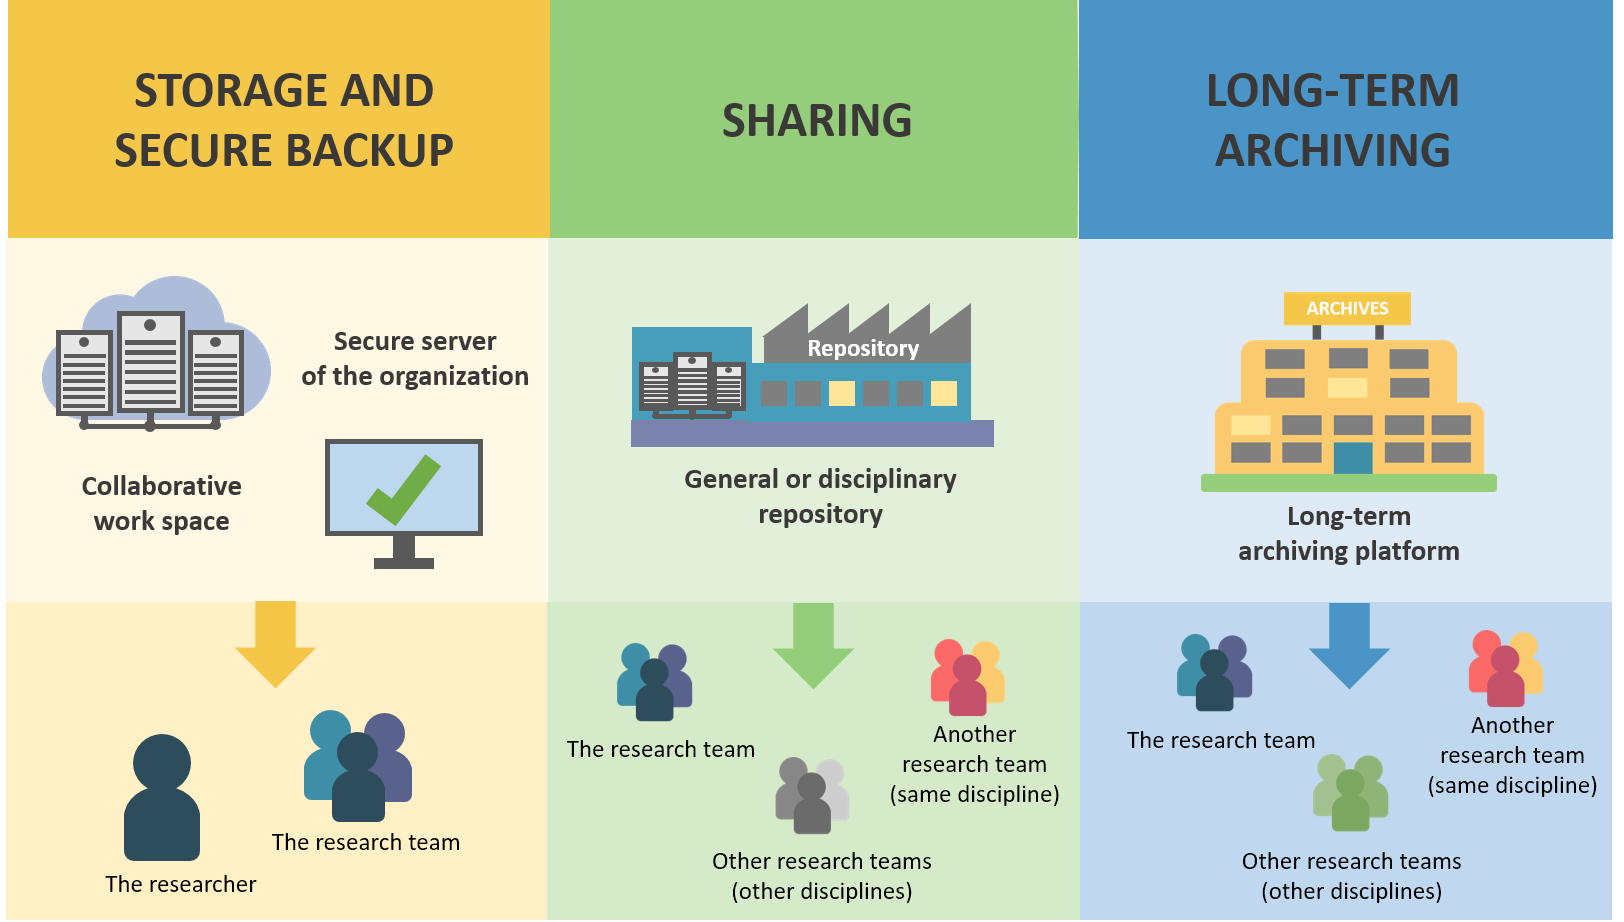
Source: DoRANum - Stockage, partage et archivage : quelles différences ?
-
1.Storage and secure data backup during the project
The first step is the storage and secure backup of the data during all the project:
The objectives are to:
- ensure data security
- facilitate access for all project collaborators
Storage and secure data backup in the data lifecycle
This concerns the first part of the data life cycle.
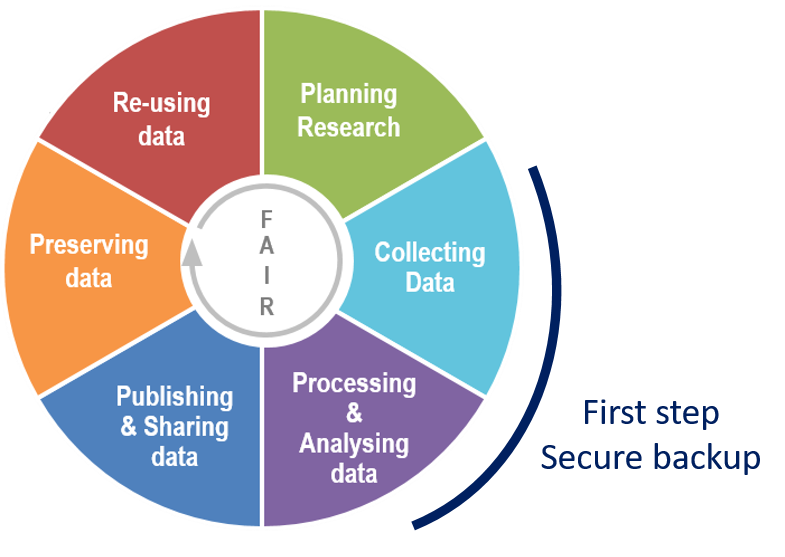
Adaptation of Research data lifecycle – UK Data Service
-
2. Depositing data in a repository for sharing
This step occurs often after the project (but you can share your data earlier): it is necessary to deposit the datasets in a repository.
A repository allow to storage, access and reuse of data.
The sharing of data in a repository provides a wide access to the scientific community, for a short and medium term (5 to 10 years).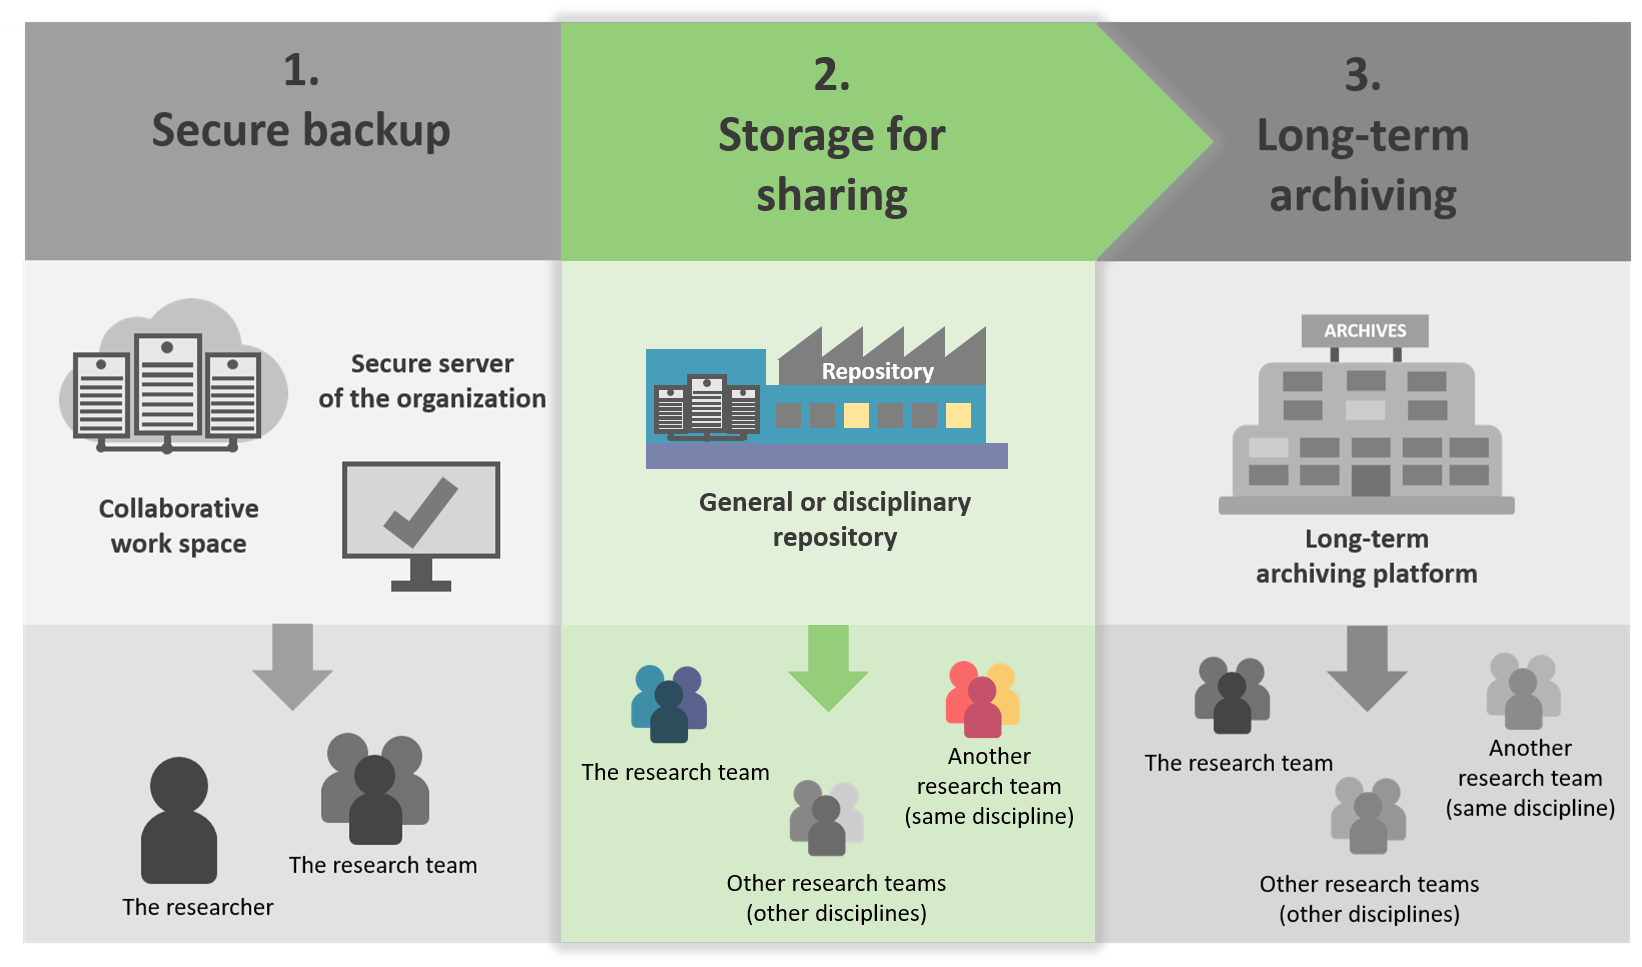
Sharing data in the data lifecycle
Data sharing is often complementary to scientific publication during and after the end of the research project.
Adaptation of Research data lifecycle – UK Data Service
-
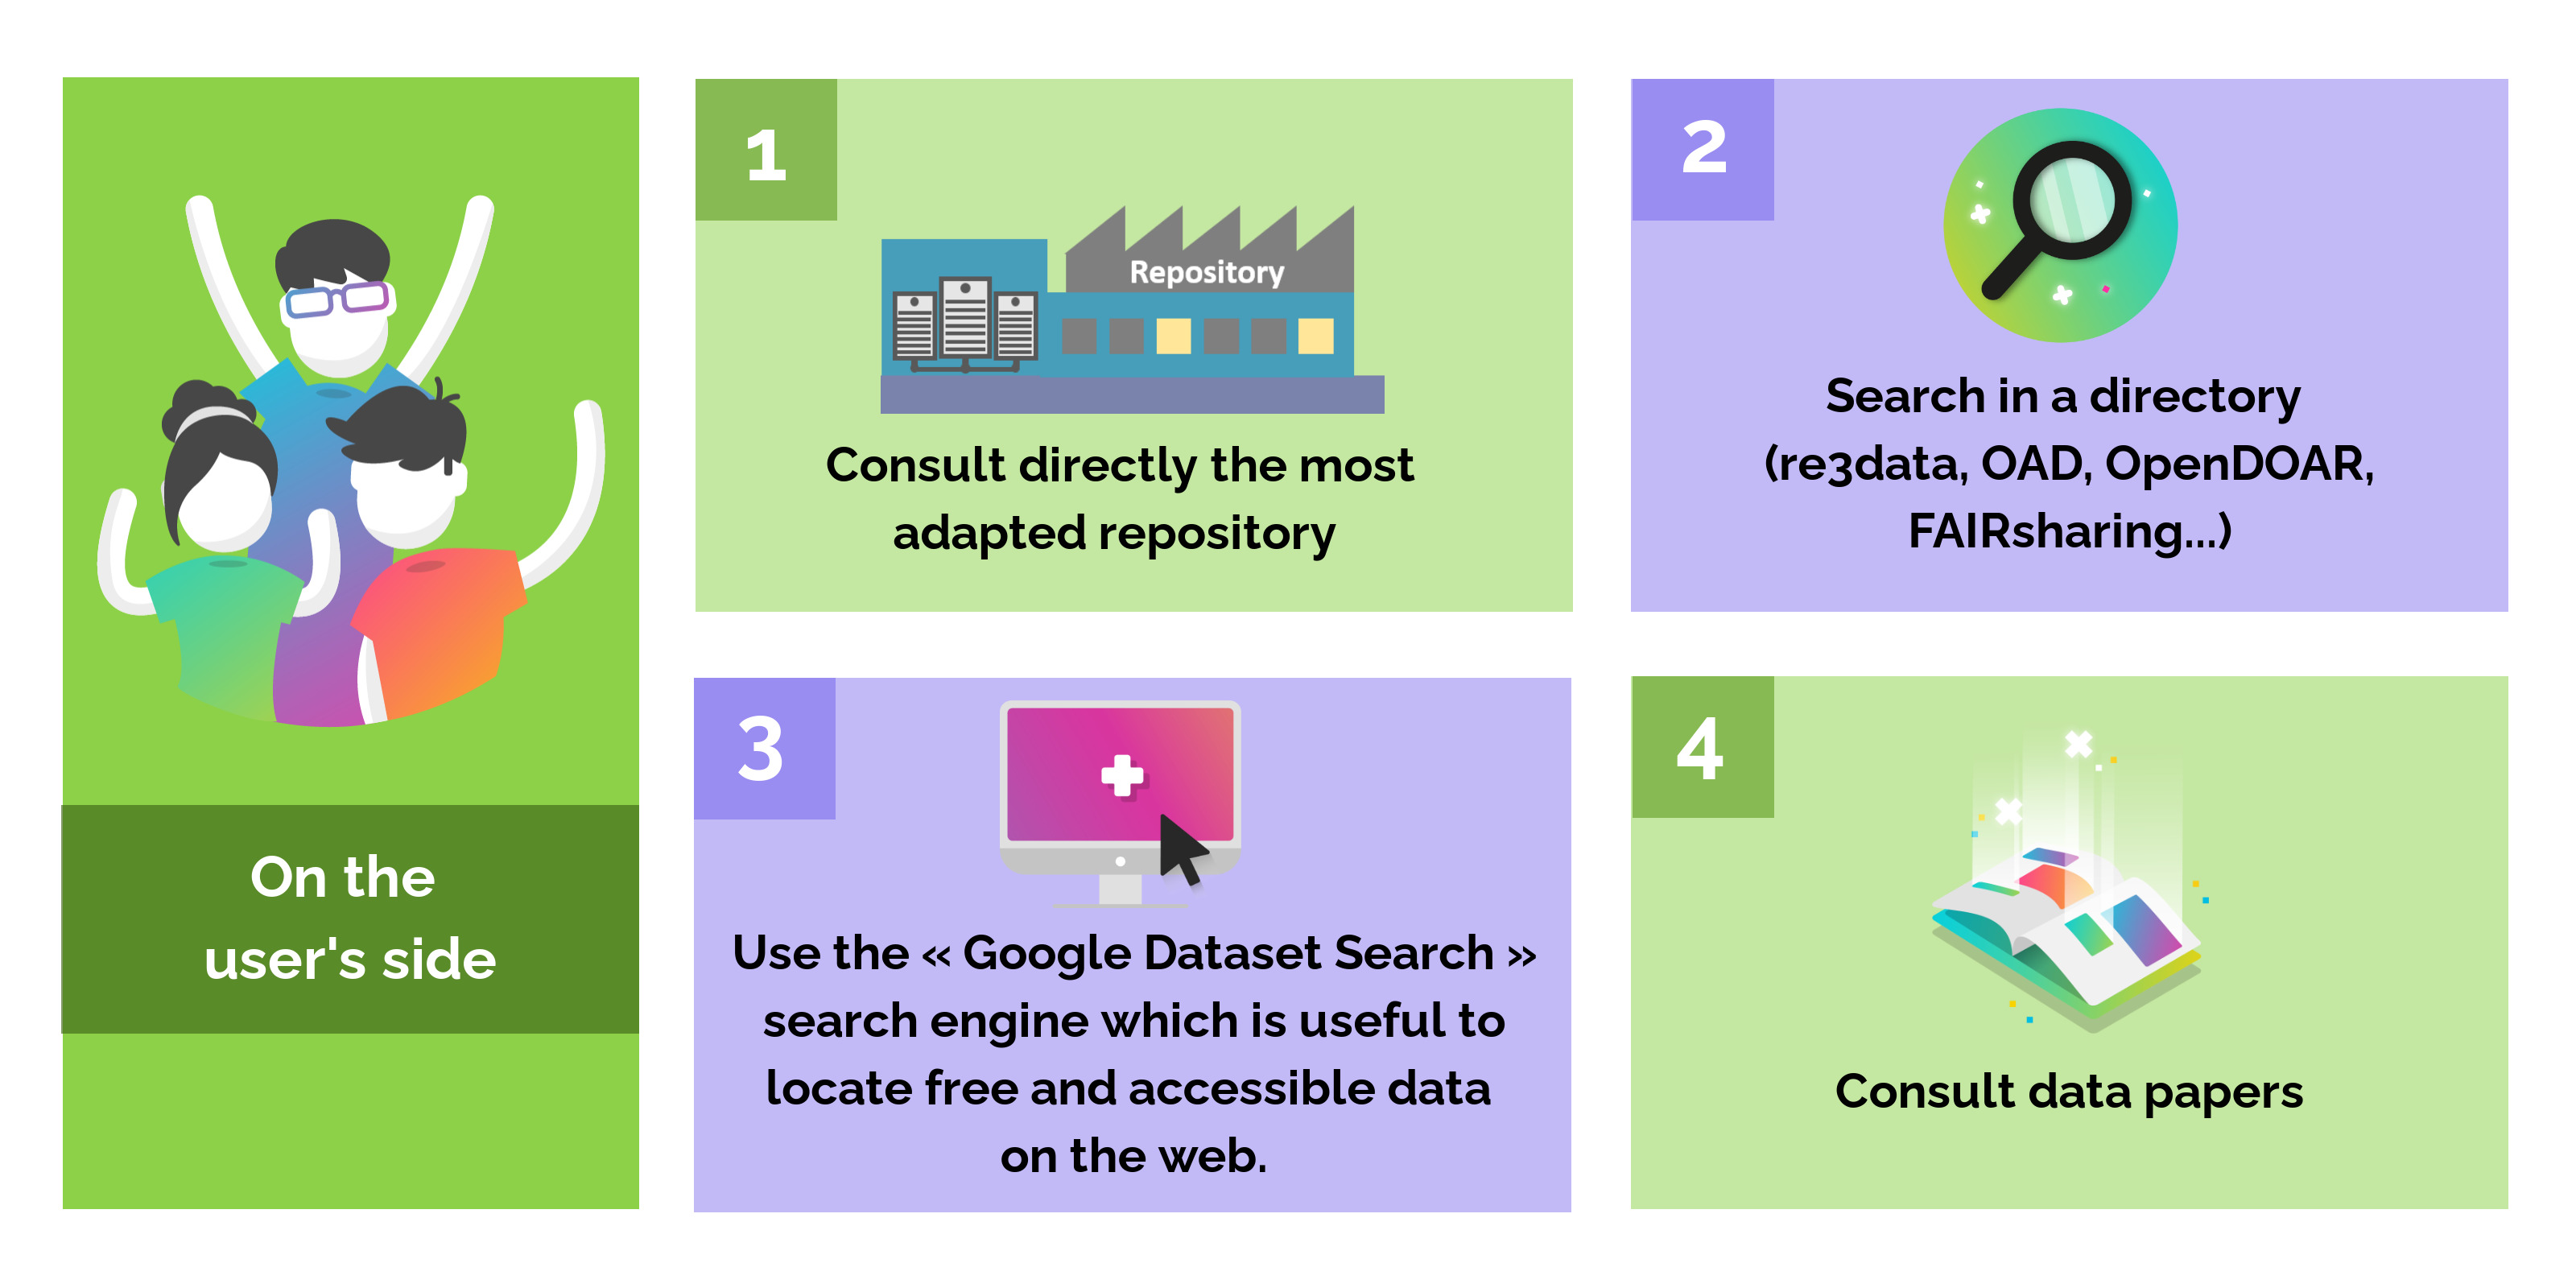
Example of a search in the re3data directory
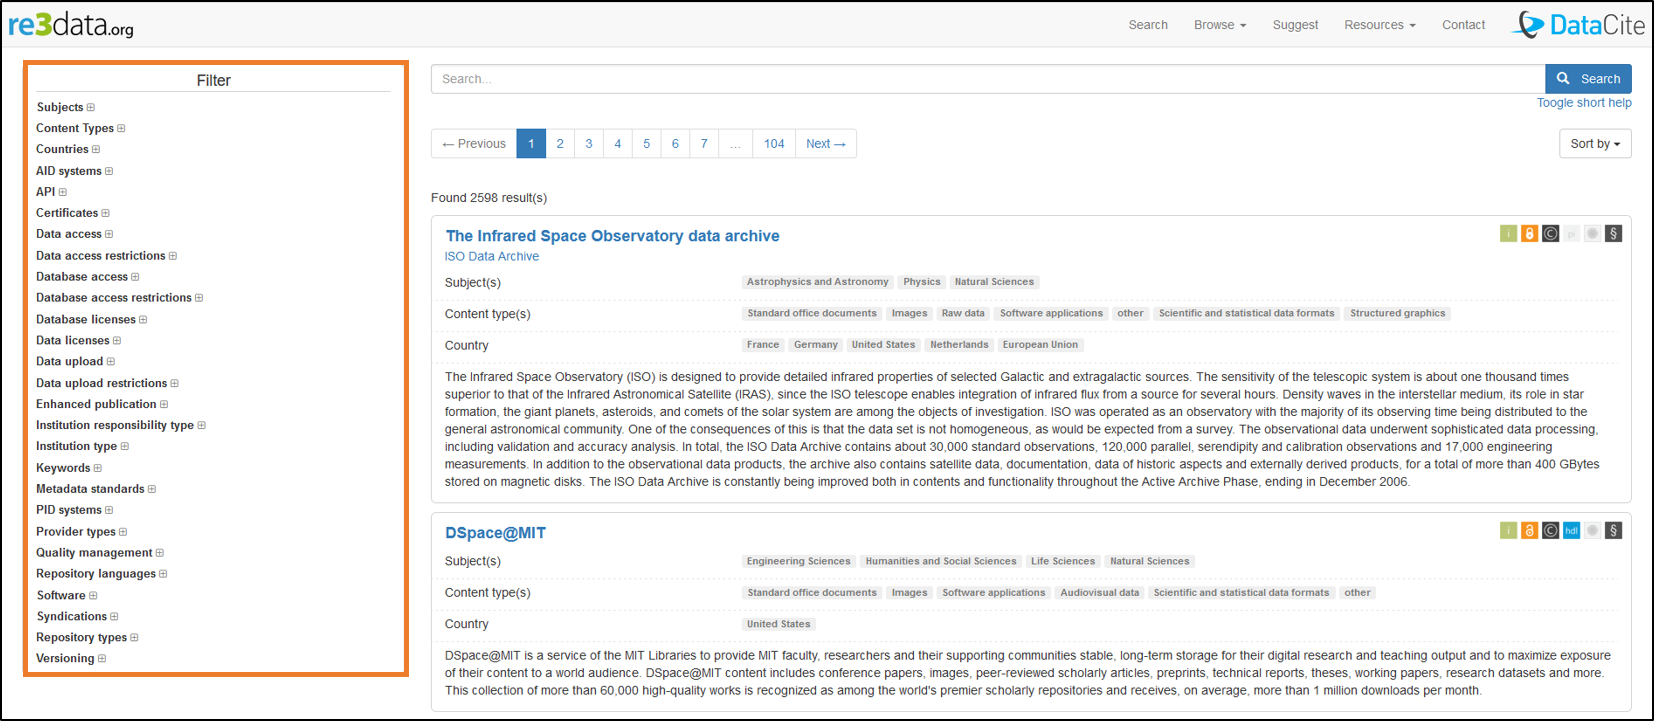
For each repository, a short descriptive sheets presents
- the subject,
- the type of content,
- the country,
- a small summary,
- icons of the criteria.
Example for the 4TU repository: https://www.re3data.org/repository/r3d100010216
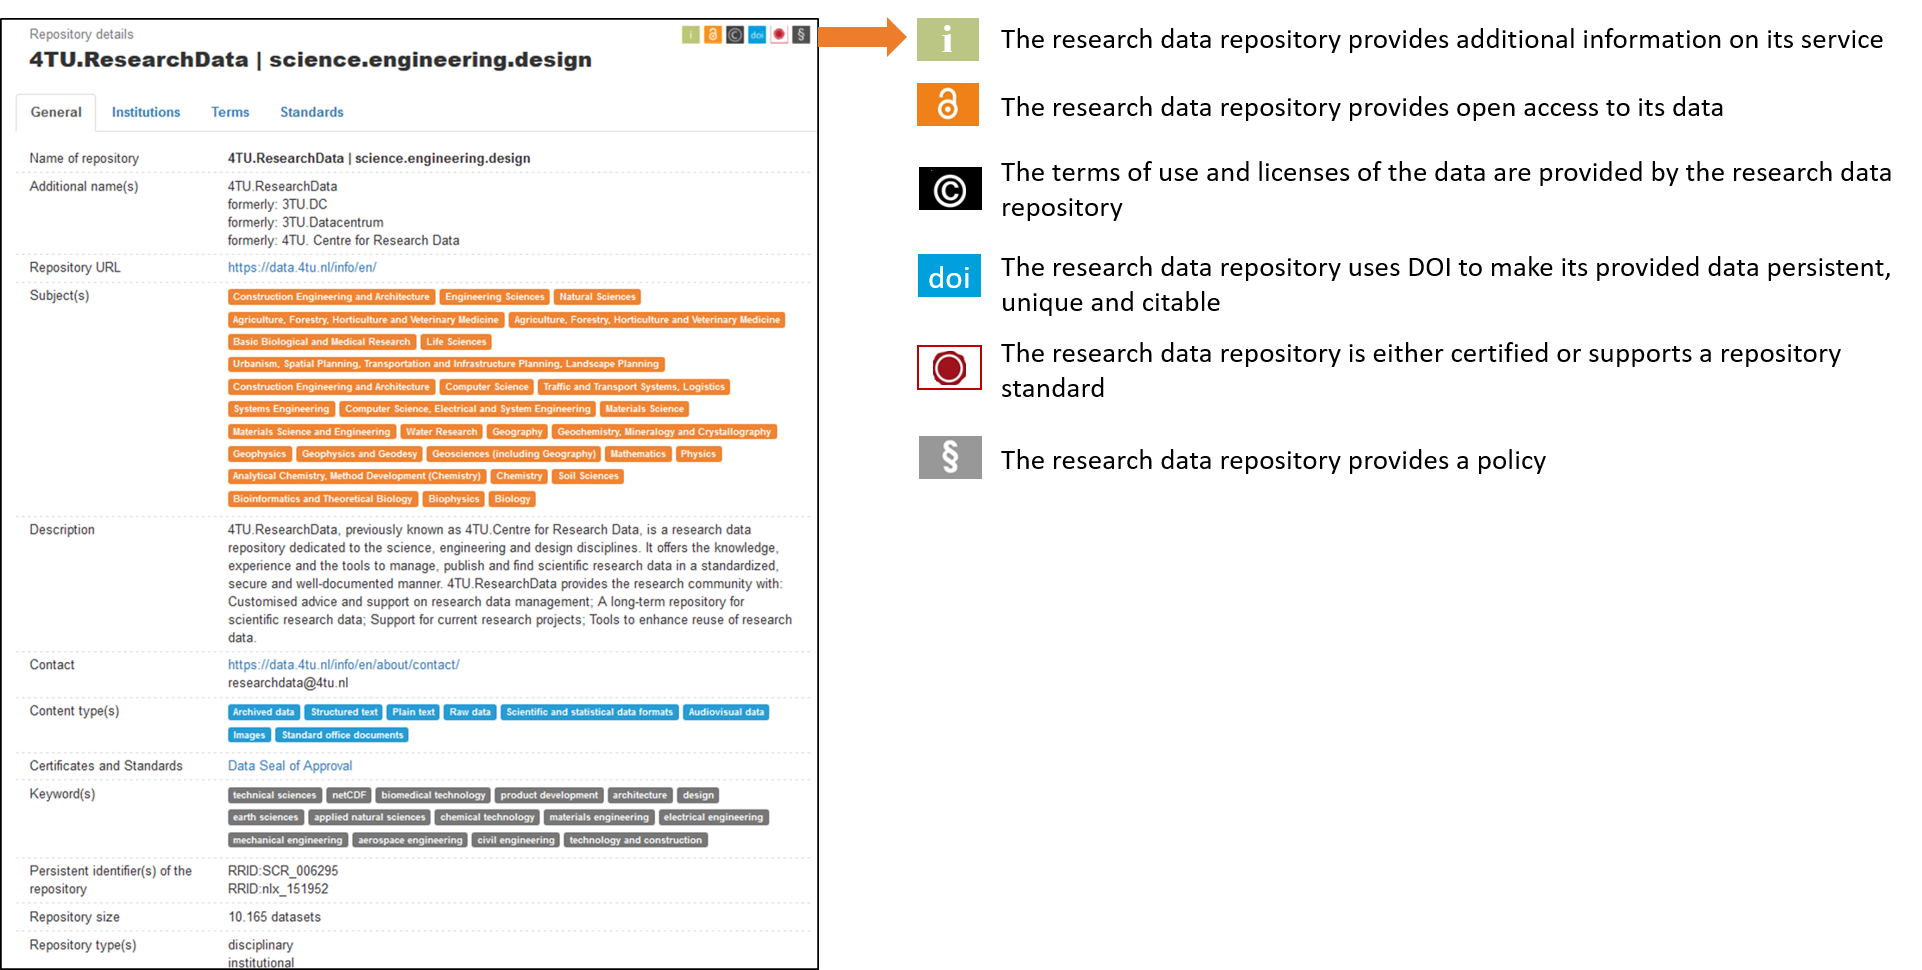
Tip: The search engine Google Dataset Search is also a simple tool to search for data repositories.
-
3. Long-term archiving
Long-term archiving is the ultimate step in saving and storage research data.
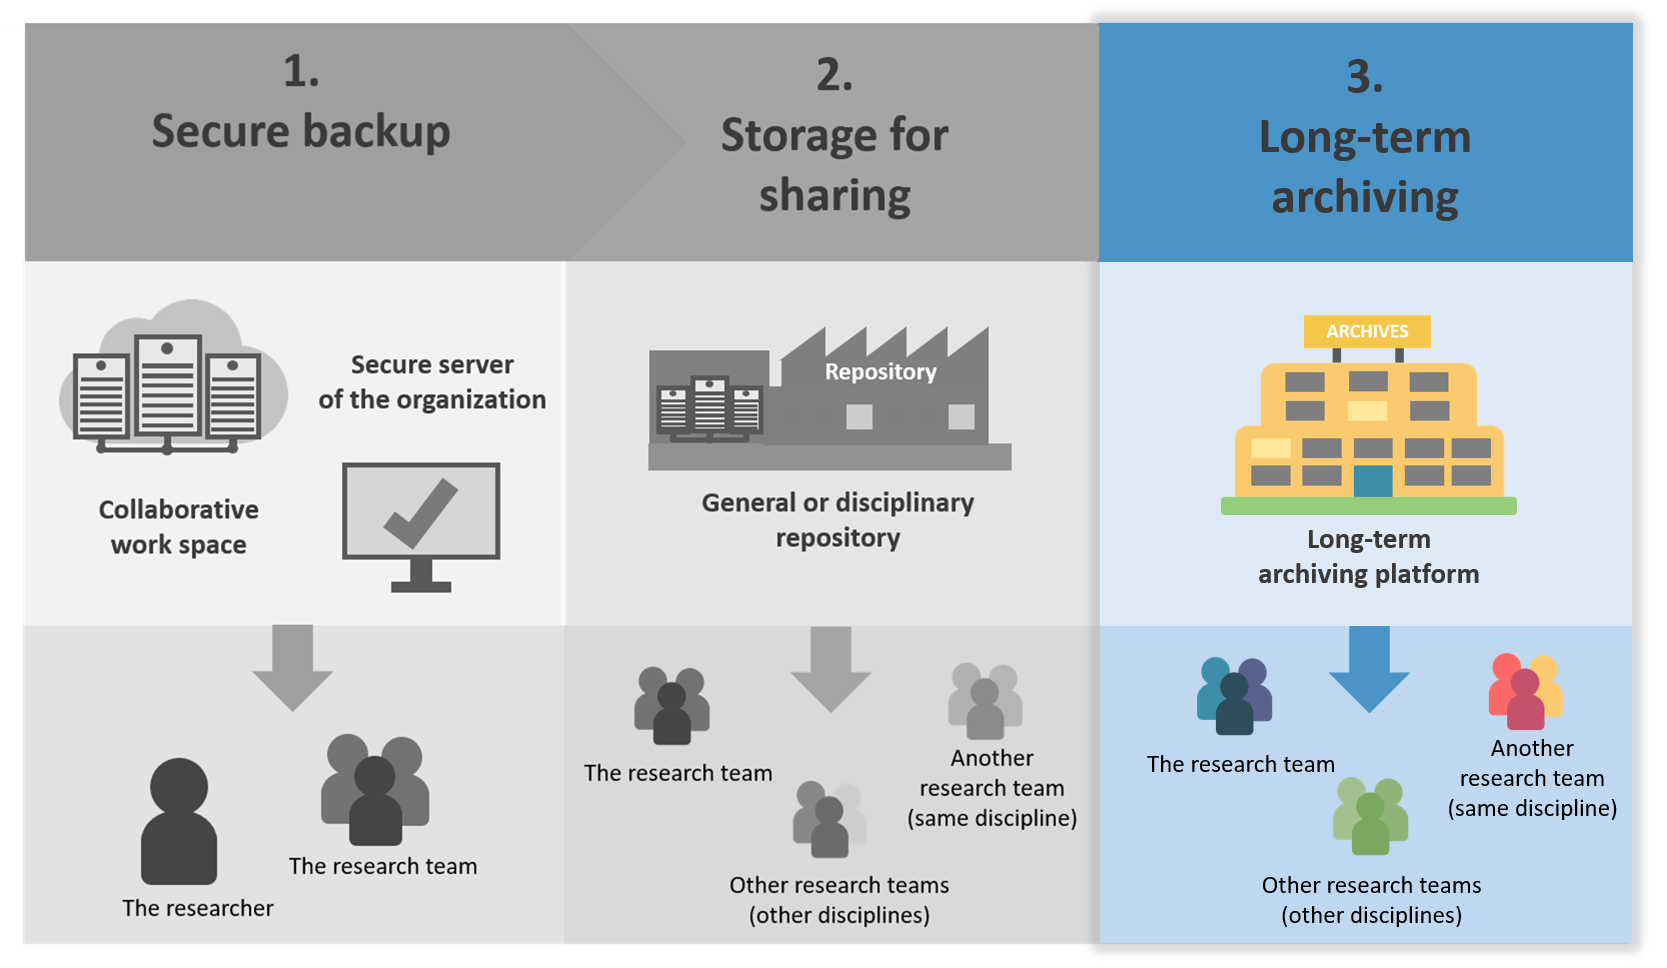
Long-term archiving in the data lifecycle
Long-term archiving generally concerns only a part of the data produced by a project. For some projects, it is not necessary to archive data.
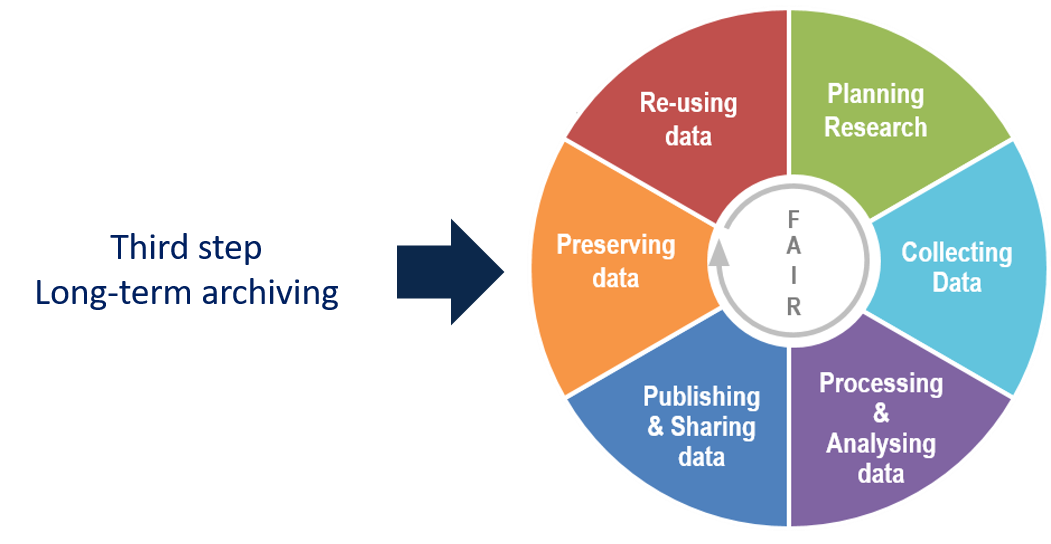
Adaptation of Research data lifecycle – UK Data Service
Definition
The question of long-term archiving only concerns data:
- with a scientific value for all the community
- requiring preservation for at least 30 years.
It is an expensive operation that needs an allocated budget. This is the responsibility of the laboratory and not the researcher.
Concretely, long-term digital archiving consists of preserving the document and its content:- in its physical and intellectual aspects,
- over the very long term,
- to be always accessible and understandable.
Long-term archiving services in Europe
At the European level, there are several infrastructures that specifically propose long-term archiving services.
The European Open Science Cloud (EOSC) Portal is an integrated platform that allows easy access to lots of services and resources for various research domains along with integrated data analytics tools. It includes services for long-term archiving, for example:EGI Archive storage: Archive Storage allows you to store large amounts of data in a secure environment freeing up your usual online storage resources. The data on Archive Storage can be replicated across several storage sites, thanks to the adoption of interoperable open standards. The service is optimised for infrequent access. Main characteristics: Stores data for long-term retention; Stores large amount of data; Frees up your online storage.
B2SAFE: this is a robust, safe and highly available EUDAT service which allows community and departmental repositories to implement data management policies on their research data across multiple administrative domains in a reliable manner. A solution to: provide an abstraction layer which virtualizes large-scale data resources, guard against data loss in long-term archiving and preservation, optimize access for users from different regions, bring data closer to powerful computers for compute-intensive analysis.
Selection of data to be archived
To select the data that will be archived for the long term, it is important to consider the value of the data:
- Are the data unique, non-reproducible (or at too high a cost)?
- Do the data have historical value, i.e., do they represent a landmark in scientific discoveries?
- Do the data include changes in processing methods, new standards, or create precedents?
- Do the data support ongoing projects or scientific trends?
- Are the data likely to meet future needs/directions of the scientific community (reuse potential)?
- Are the data likely to be cited or referenced in a publication?
- ...
- The quality and compliance of data collection must be controlled and documented. This may include processes such as calibration, sample or measurement repetition, standardized data capture, data entry validation, peer review...
- Quality, physical integrity of data (undamaged, readable...)
- What is the policy of the funder, the institution?
- Are the data compliant with the institution's strategy?
- Is there a legal or legislative reason to preserve the data?
- Is there an obvious reason why the data might be used in litigation, public inquiries, police investigations, or any report or document that could be challenged in court?
- Are there financial or contractual obligations that require data preservation?
When considering data preservation, the cost of conservation (identified not only as storage, but also management, sharing, access, backup, and long-term data maintenance) must be weighed against evidence of potential data reuse.
Consult the research archives management reference guide, Association of French Archivists, Aurore Section.
Source :- NERC Data Value Checklist. https://www.ukri.org/publications/nerc-data-value-checklist/(opens in a new tab)
- DoRANum : Données de la recherche : apprentissage numérique [En ligne]. France : DoRANum; 2017. Le Référentiel de gestion des archives de la recherche [publié le 13/05/2019]. Disponible(opens in a new tab) i(opens in a new tab)ci(opens in a new tab).
Preparation of the data to be archived
Here is a checklist to prepare your data for long-term archiving:
- Selection of datasets: The datasets (and associated metadata) selected may be different from the shared datasets.
- Volume: Evaluate the volume of data and the necessary budget.
- Data treatment: Treatment of some data may be necessary. For example, personal data requires anonymization.
- File formats: Check the validity of data file formats according to the recommendations of the archive selected.
- Software: Document and perhaps also provide the software used to access the data.
- Metadata: Complete and enrich the metadata if necessary, according to the recommendations of the archive selected.
-
-
-
1. Reuse and enhancement of data in the data lifecycle
This is the final step in the data life cycle but also the starting point of a new cycle if the data are reused for a new research project.
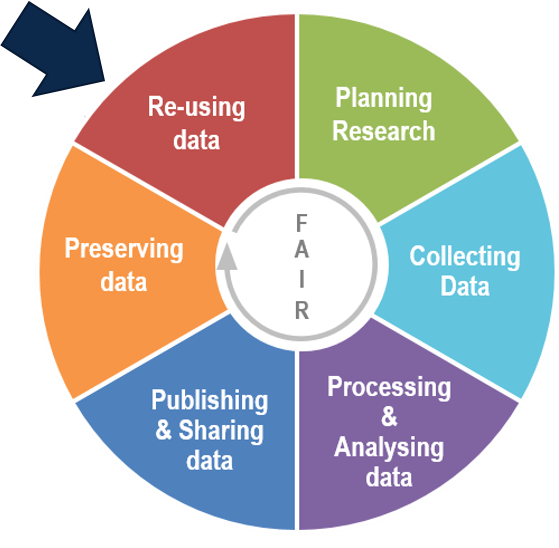
Adaptation of Research data lifecycle – UK Data Service
It is important to prepare the data for sharing in order to make it FAIR. This way other researchers can use them for new research projects.
-
2. Reuse and citation of data
On the researcher's side
In order to ensure that the research data they have generated can be reused under good conditions, researcher must adopt several good practices:
On the user’s side
There are several ways for a researcher to find reusable datasets:
Links :
In all cases, re-users must respect certain rules:
- Respect the intellectual property of the authors as mentioned in the licence
- Cite the data if the license requires it (it is recommended to always cite its sources)
- Link data to publications.
Tip: there are tools to help you cite a dataset correctly, such as:
- The "Cite all versions" part proposed by the Zenodo repository
- The DOI Citation Formatter service which allows you to simply and automatically obtain a complete citation from a DOI.
To complete, see the summary sheet on data citation proposed by DataOne:
Source : https://dataoneorg.github.io/Education//lessons/08_citation/L08_DataCitation_Handout.pdf -
3. Data papers and data journals
Writing and publishing a data paper is a good way for researchers to add value to their research data.
A data paper is a publication that describes research datasets and associated metadata. It follows the same editorial process as traditional scientific articles:
- Elements common to classic articles (title, abstract, keywords…)
- Specific data elements (data types, formats, production processes and methods, metadata, reuse…)
A data paper can be published in a data journal (journal dedicated to this type of publication) or in a classic journal that accepts data papers.
Access to data from the data paper can be done in two ways:
- the data are integrated in the article and published as supplementary data
- the data are deposited in a repository and this is the persistent identifier (example: the DOI) that links data paper with data.
An example of data papers in the domain of environment
Two data papers were written on photographic data to study the evolution of vegetation phenology in different ecosystems across North America. The data are derived from automated digital images (taken every 30 minutes), collected via the PhenoCam network. The data are time series characterizing the color of the vegetation, including the degree of greening. The PhenoCam Explorer interface has been developed to facilitate data exploration and visualization, from which the user can also download data on a site-by-site basis. The images are also available in real time through the PhenoCam project web page.
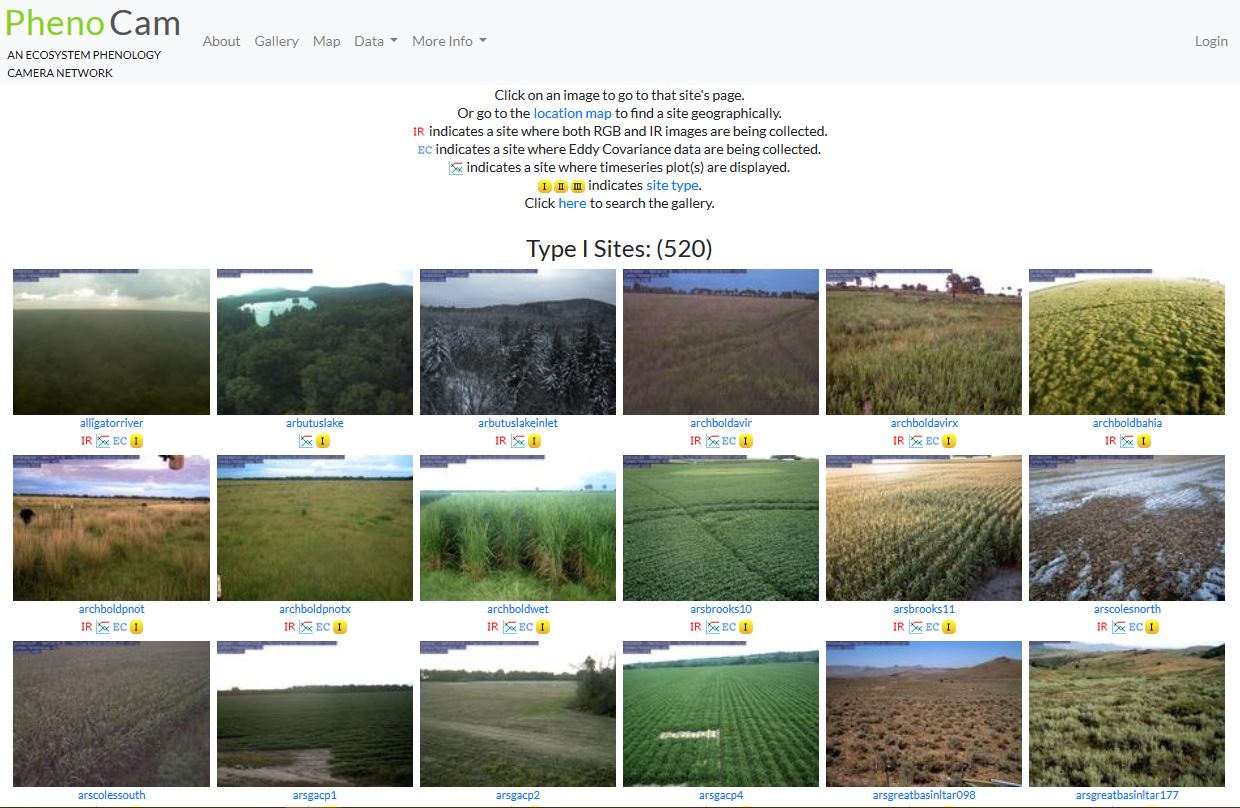
- Tracking vegetation phenology across diverse North American biomes using PhenoCam imagery: This data paper published in 2018 presents version 1.0 of a series of datasets, all assembled, constituting about 750 years of observations (more than 15 million images produced by about 400 automated digital cameras). The data were deposited in NASA's ORNL DAAC repository.
- Tracking vegetation phenology across diverse biomes using Version 2.0 of the PhenoCam Dataset: This data paper published in 2019 presents version 2.0 of a series of datasets of 1783 site-years and 393 digital cameras located in different ecosystems in a wide range of plant functional types, biomes, and climates. The quality of the datasets has been improved. The data were deposited in NASA's ORNL DAAC repository.
-
4. Data exposure and visualization
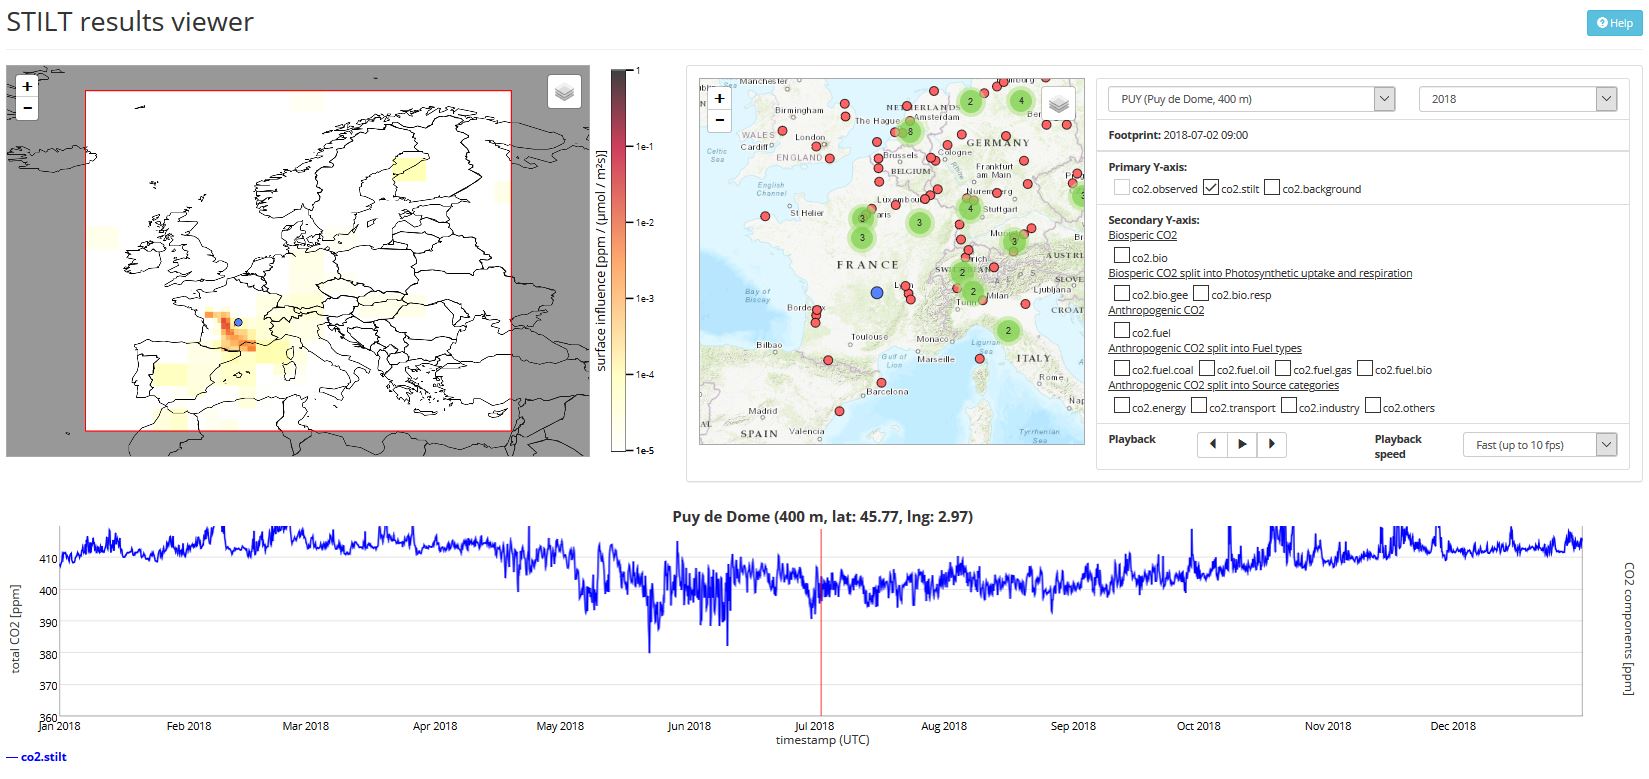
In addition to depositing data in a repository, and perhaps publishing a data paper, exposing the data is another good way to add value.
Indeed, expose data in visual form (maps, graphs, etc.) via a platform is indicated especially in the case of large and complex data.
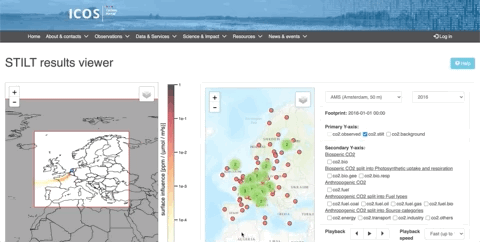
Example 1
These data (available on the ICOS Carbon Portal) comes from time series of values on hundreds of parameters. With visualization tools, we can see the evolution of CO2 concentrations over a year, coupled with the origin of the air mass. This would be very difficult to understand without data visualization.
Example 2
CoReA: a digital library has been created with the Omeka tool for the archaeological documentation of the CNRS French Centre Camille Julian. It allows to navigate easily through archaeological corpus and resources.
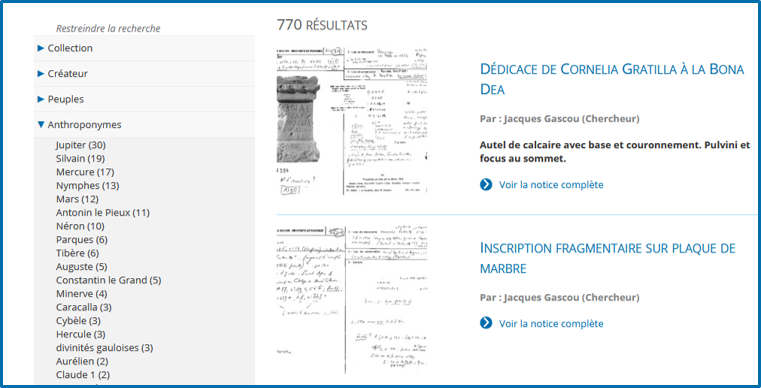
Omeka is an open-source web publishing platform for sharing digital collections and creating media-rich online exhibits.
From raw research data, the tool allows the creation of editorialized collections (structured, accessible, and visible on the web). The tool offers a great modularity of functionalities thanks to numerous plugins, and handles various multimedia objects (texts, images, sounds, videos).
The tool offers several technical advantages:
- the interface is simple and intuitive;
- the metadata can be harvested, allowing in particular the referencing in other databases;
- an Omeka collection can be connected to other services thanks to a REST API.
Example 3
See the example of data visualization from the "Republic of Letters", where researchers map thousands of letters exchanged in the 18th century and can learn very rapidly what it once took a lifetime of study to comprehend (Seen in the Lesson 1 Unit 2: Data and Science): https://www.youtube.com/watch?v=nw0oS-AOIPE.
-
-
-
Test your knowledge on this first part of the introduction to data management and sharing.
Success in this test is rewarded by an Open Badge! To pass this test, you must be enrolled in the course
Check
-